26 April 2006
This text was machine-transcribed from the printed book and may contain errors. Select the words and choose “Report a mistake”.
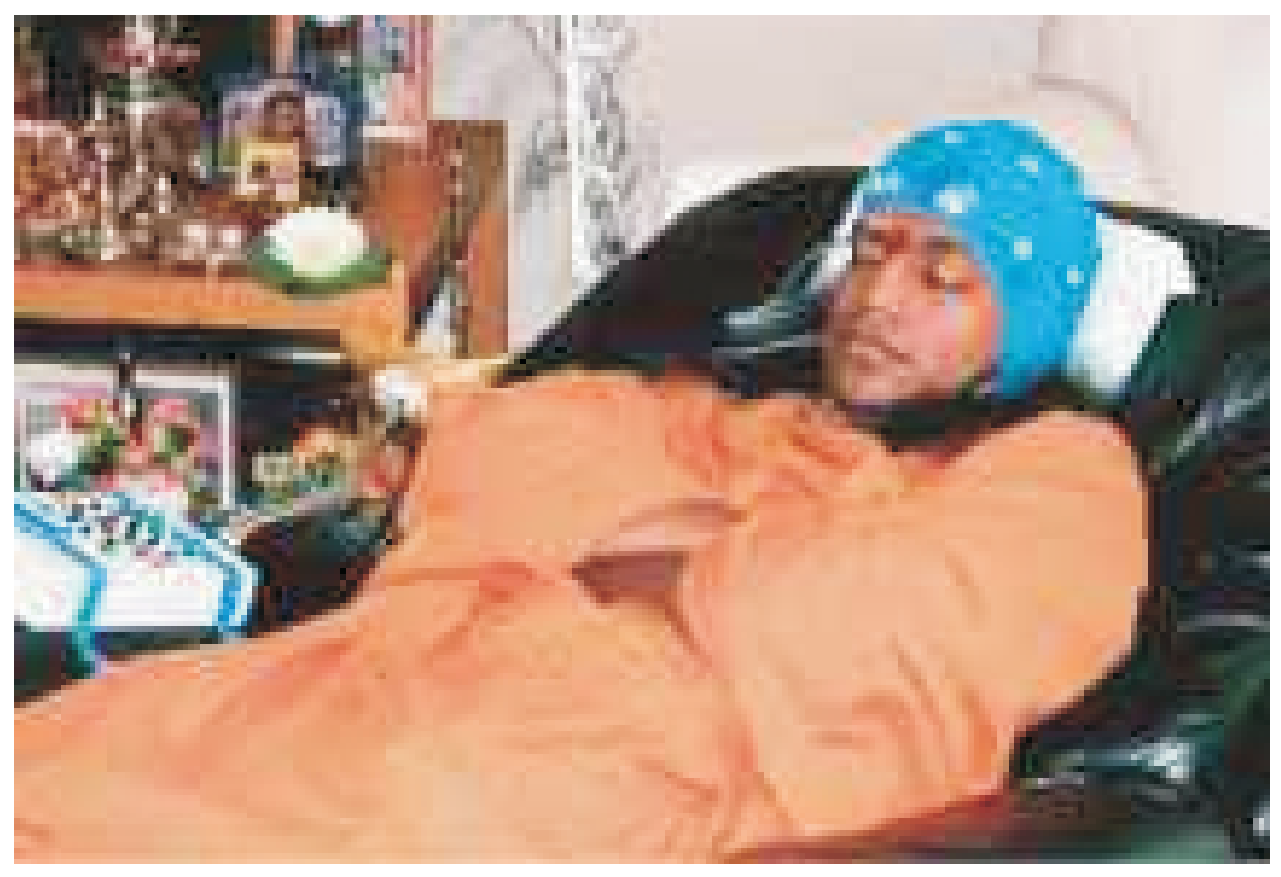
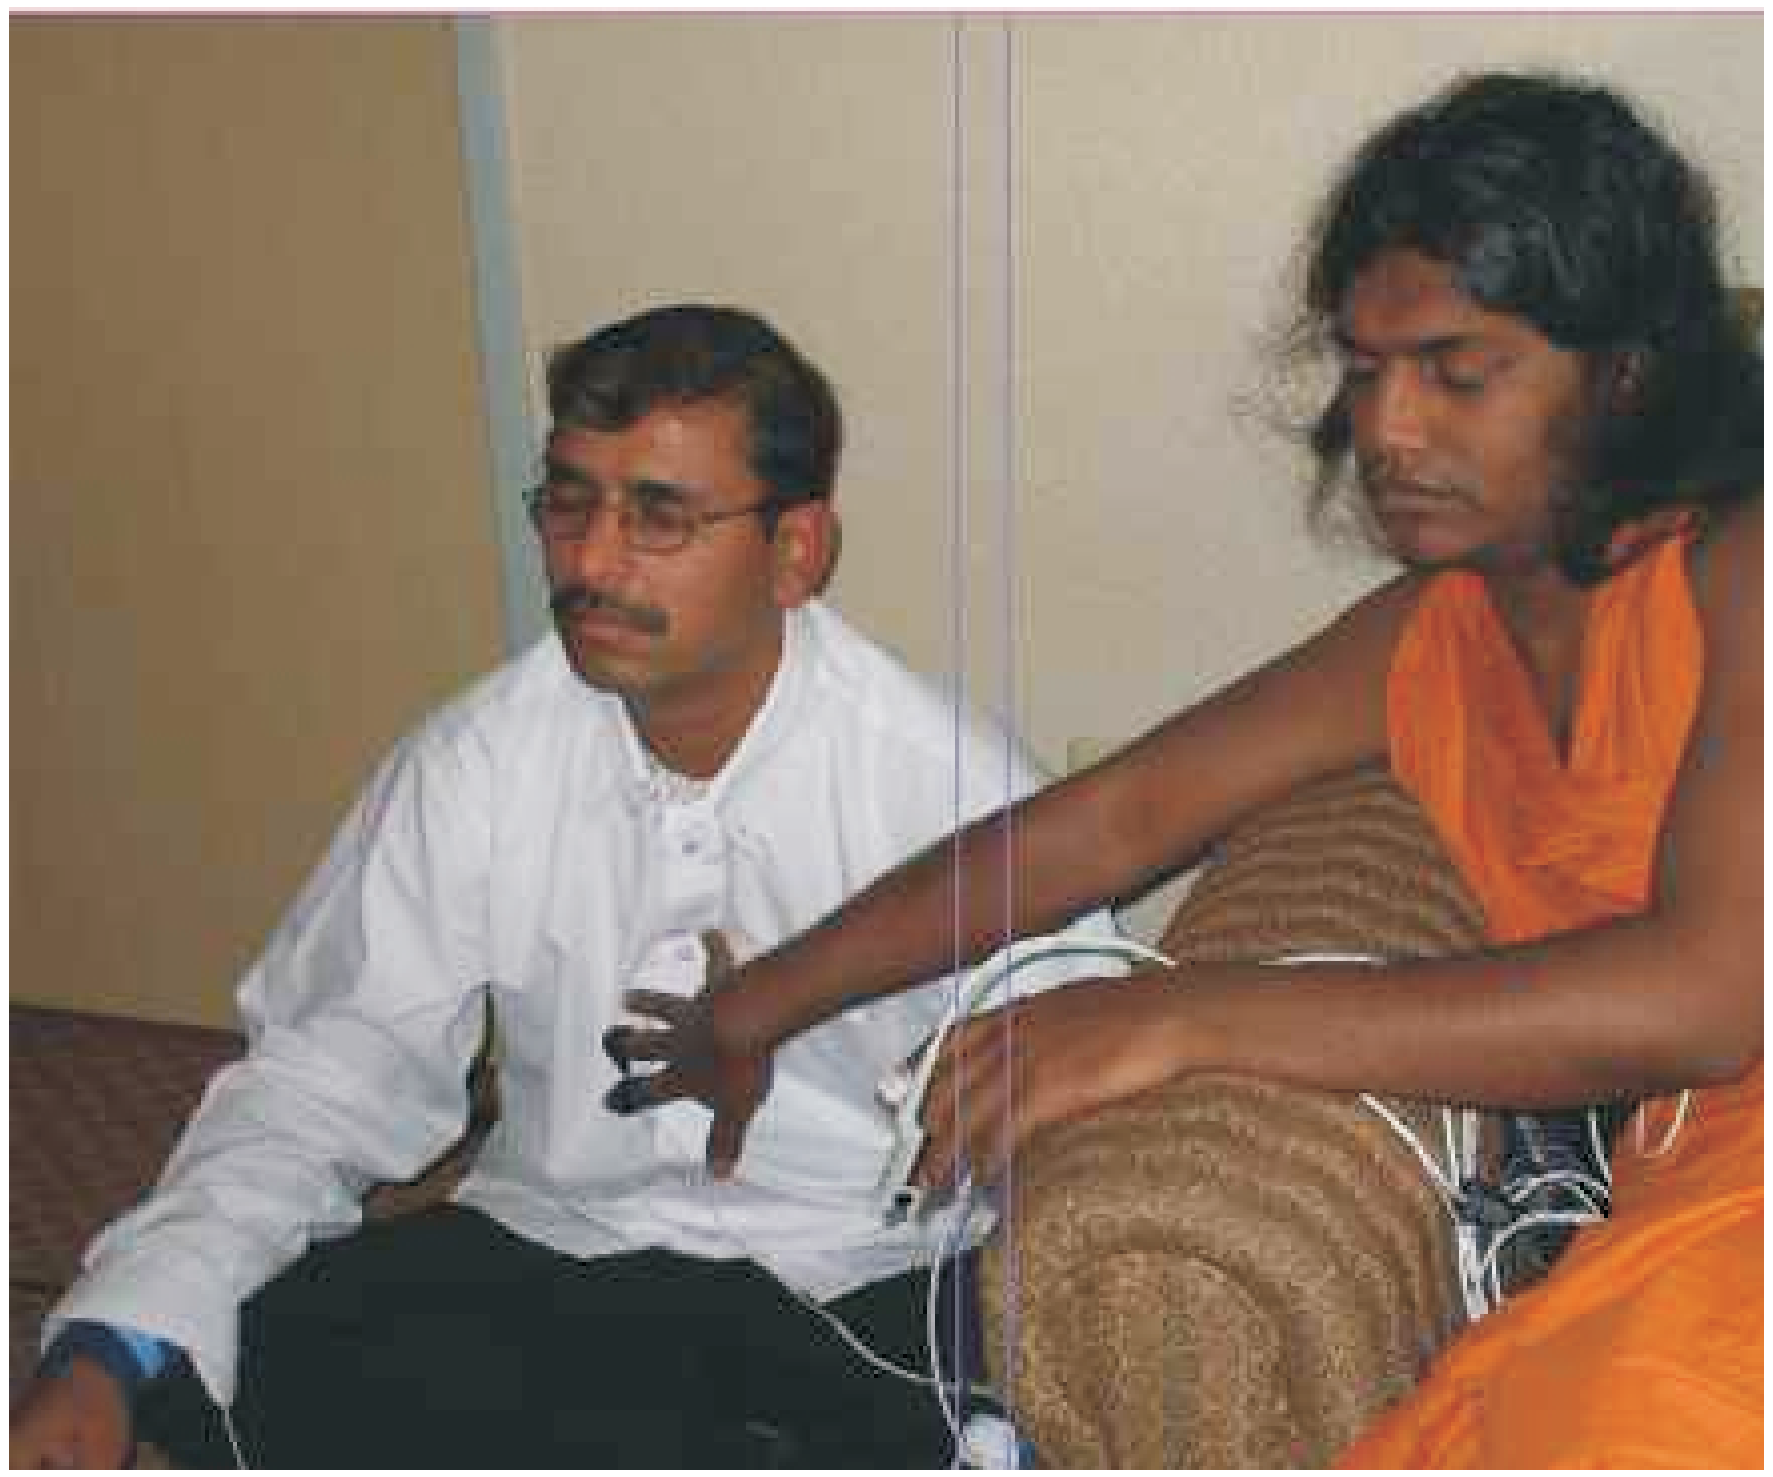
Seattle, Wa. USA. Dr. Juan Acosta-Urquidi and his associate, Ann Trechak from Sound Health Designs, LLC, Wichita, KS, USA made observations of brain waves and other vital metabolic activity during normal, deep sleep, meditating and healing states of Swamiji.
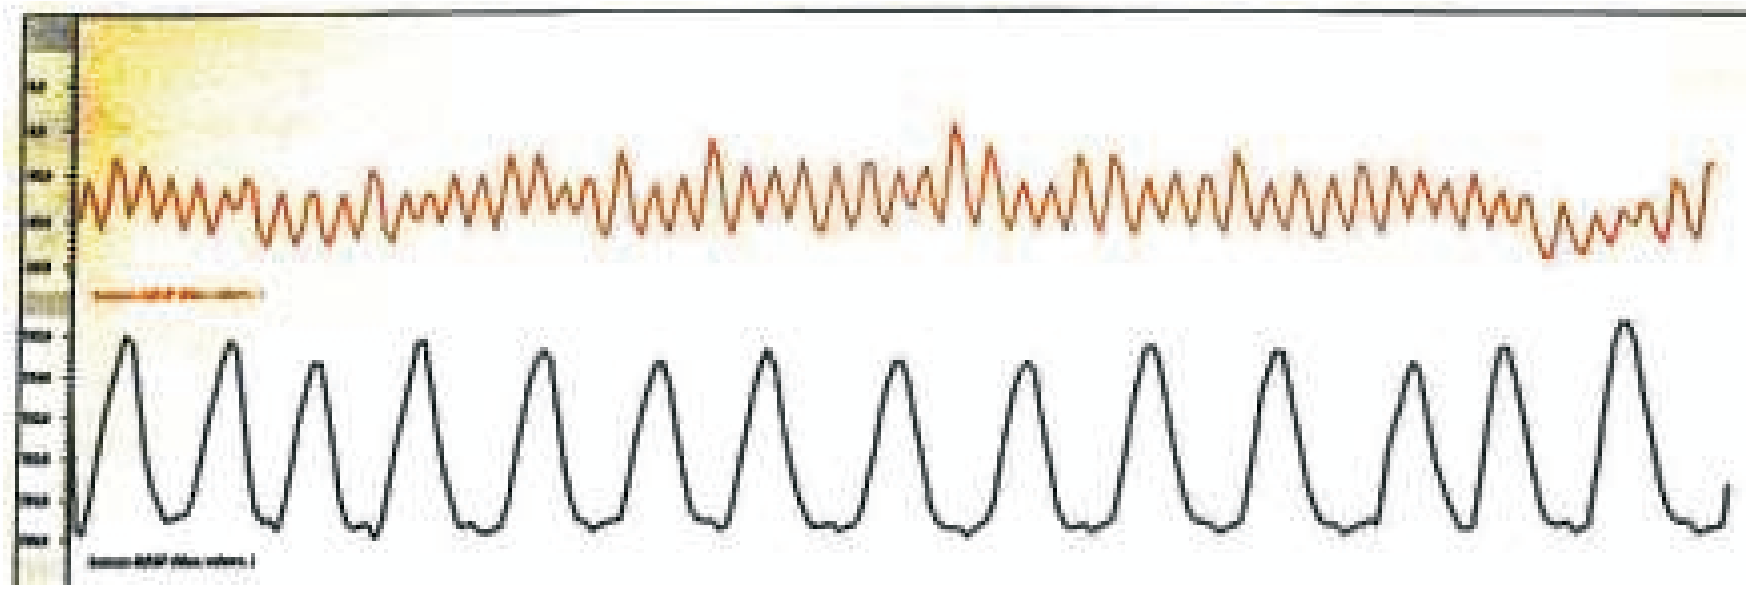
Breathing and Heart
rate rhythm: The re-
markably smooth and
uniform breathing pat-
tern, (bottom trace,
blue), is approxi-
mately 13 breath
cycles per minute
when Swamiji was in
Samadhi state.
Upper trace is BVP
(Blood Volume Pulse,
measure of heart rate
rhythm) and also
reveals a very constant
ordered pattern. This
signifies high coherence state.
a
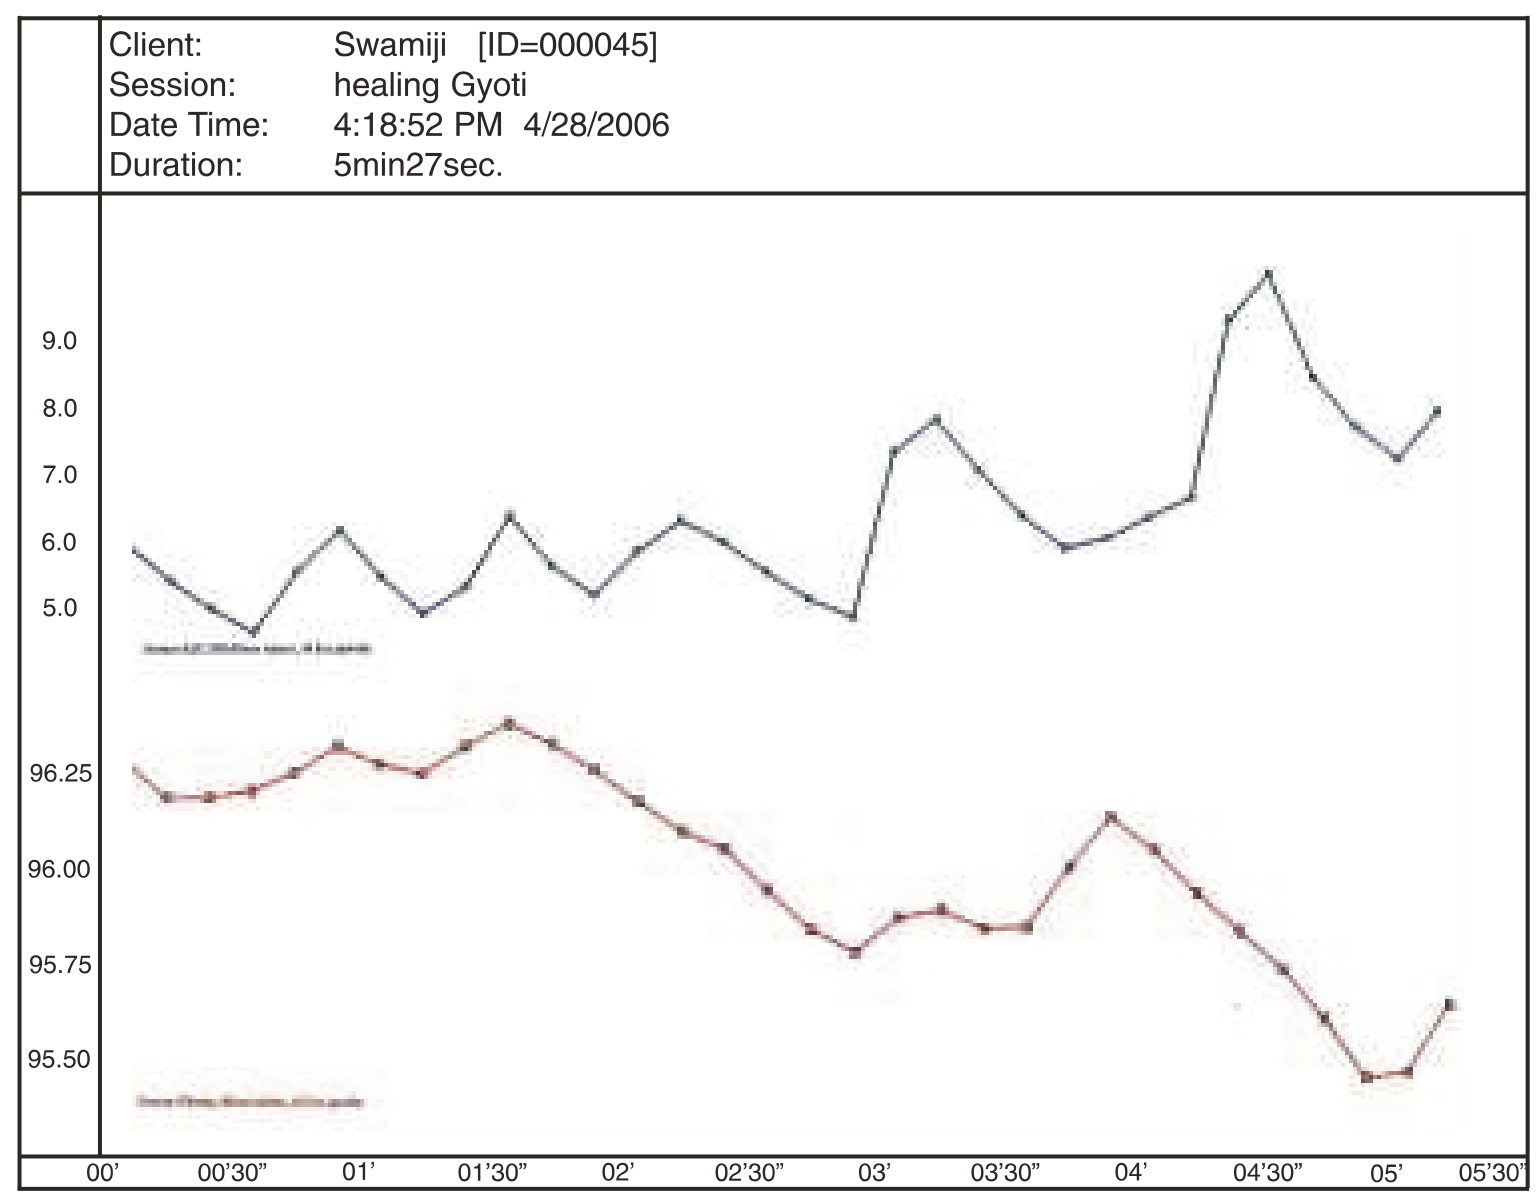
During Healing: The graph below shows simultaneous records of Temperature and GSR (Galvanic Skin Response, a measure of autonomic arousal) during a Healing session. Swamiji had a very steady consistent low baseline GSR reading (values less than 1.0 Mhos) at all times - baseline, meditation and samadhi state - except when entering the Healing state. In this example, his GSR started to in-crease gradually as he was getting ready to heal and then shows rapid very robust increases (spikes in the blue graph). His mean GSR values changed from a minimum 4.49 to maximum 11.0.
Temperature on the other hand, showed very little variation uring the entire session (mean 96 F).
This suggests Swamiji metabolic state is very constant and stable.
GSR (also referred to as Skin Conductance Level, SCL) is a measure of skin conductance to electric-ity (measured in mhos, the reciprocal of ohms, a measure of resistance). GSR reflects sweat gland activity (perspiration), which is under the control of the ANS (Autonomic Nervous System). GSR sensors on the fingertips measure the level of arousal, relaxation vs. tension, a subject is experienc-ing. Low GSR values represent very low level of arousal (deep relaxed, calm state). A sudden in-crease in GSR value reflects increased arousal level (increased skin perspiration conducts electricity better) due to ANS sympathetic activation, such as occurs when subject is in high alert.
| Channel | Min. | Max. | Mean. | Var. | StdDev. | %>Th1. | %<Th2 |
|---|---|---|---|---|---|---|---|
| Sensor-E:SC/GSR | 4.49 | 11.00 | 6.26 | 1.73 | 1.31 | 100.00 | 0.00 |
| Sensor-F:Temp. | 95.40 | 96.39 | 96.03 | 0.06 | 0.25 | 100.00 | 0.00 |
In the case of Swamiji, I interpret sudden increased GSR in preparation for, and during healing, as an increased level of sympathetic ANS activity, because he is running energy to deliver during Healing! The HRV (Heart Rate Variability) measures I obtained when Swamiji is healing a subject also reveal increased sympathetic ANS activation. This result during healing is therefore consistent, and two separate physiological measures (GSR and HRV) confirm it!
Following are brainstate patterns and colored topo maps of the brain with Baseline readings, Meditation, Deep Samadhi and Healing states' readings.
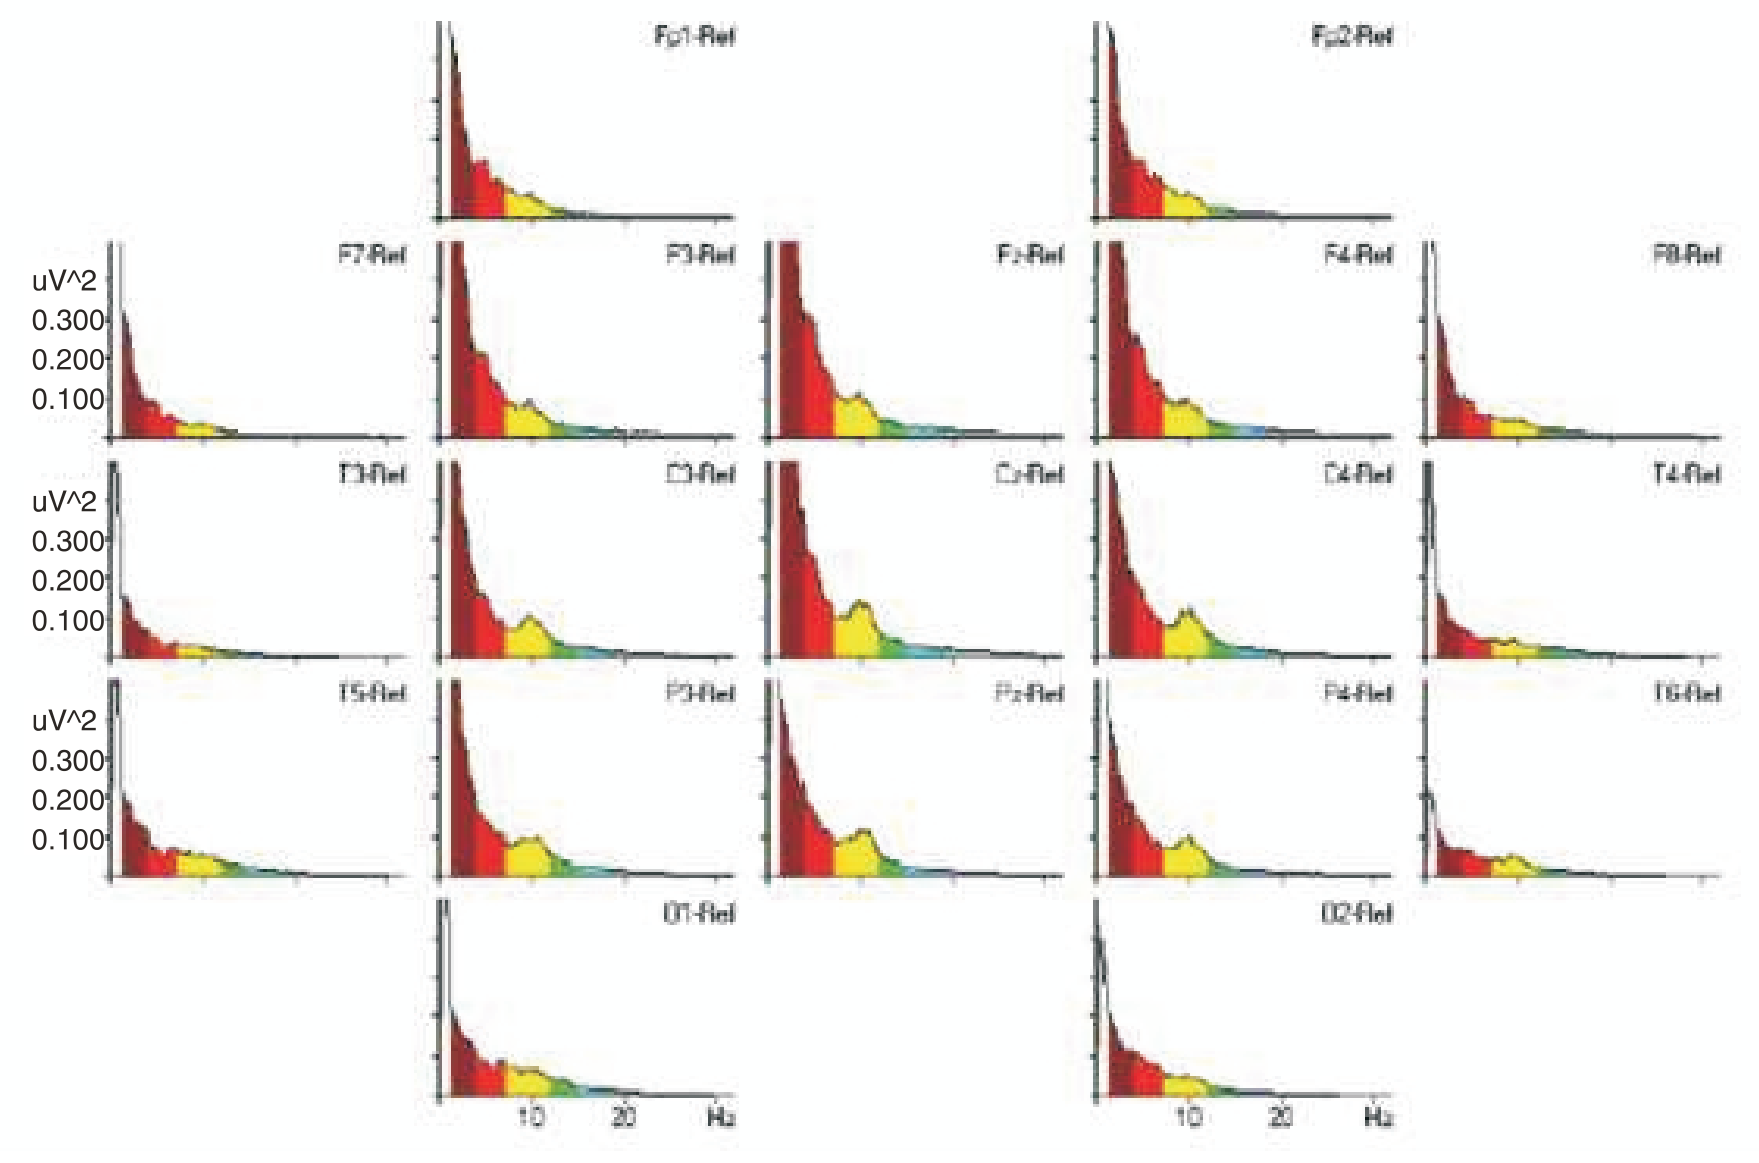
Baseline eyes closed condition
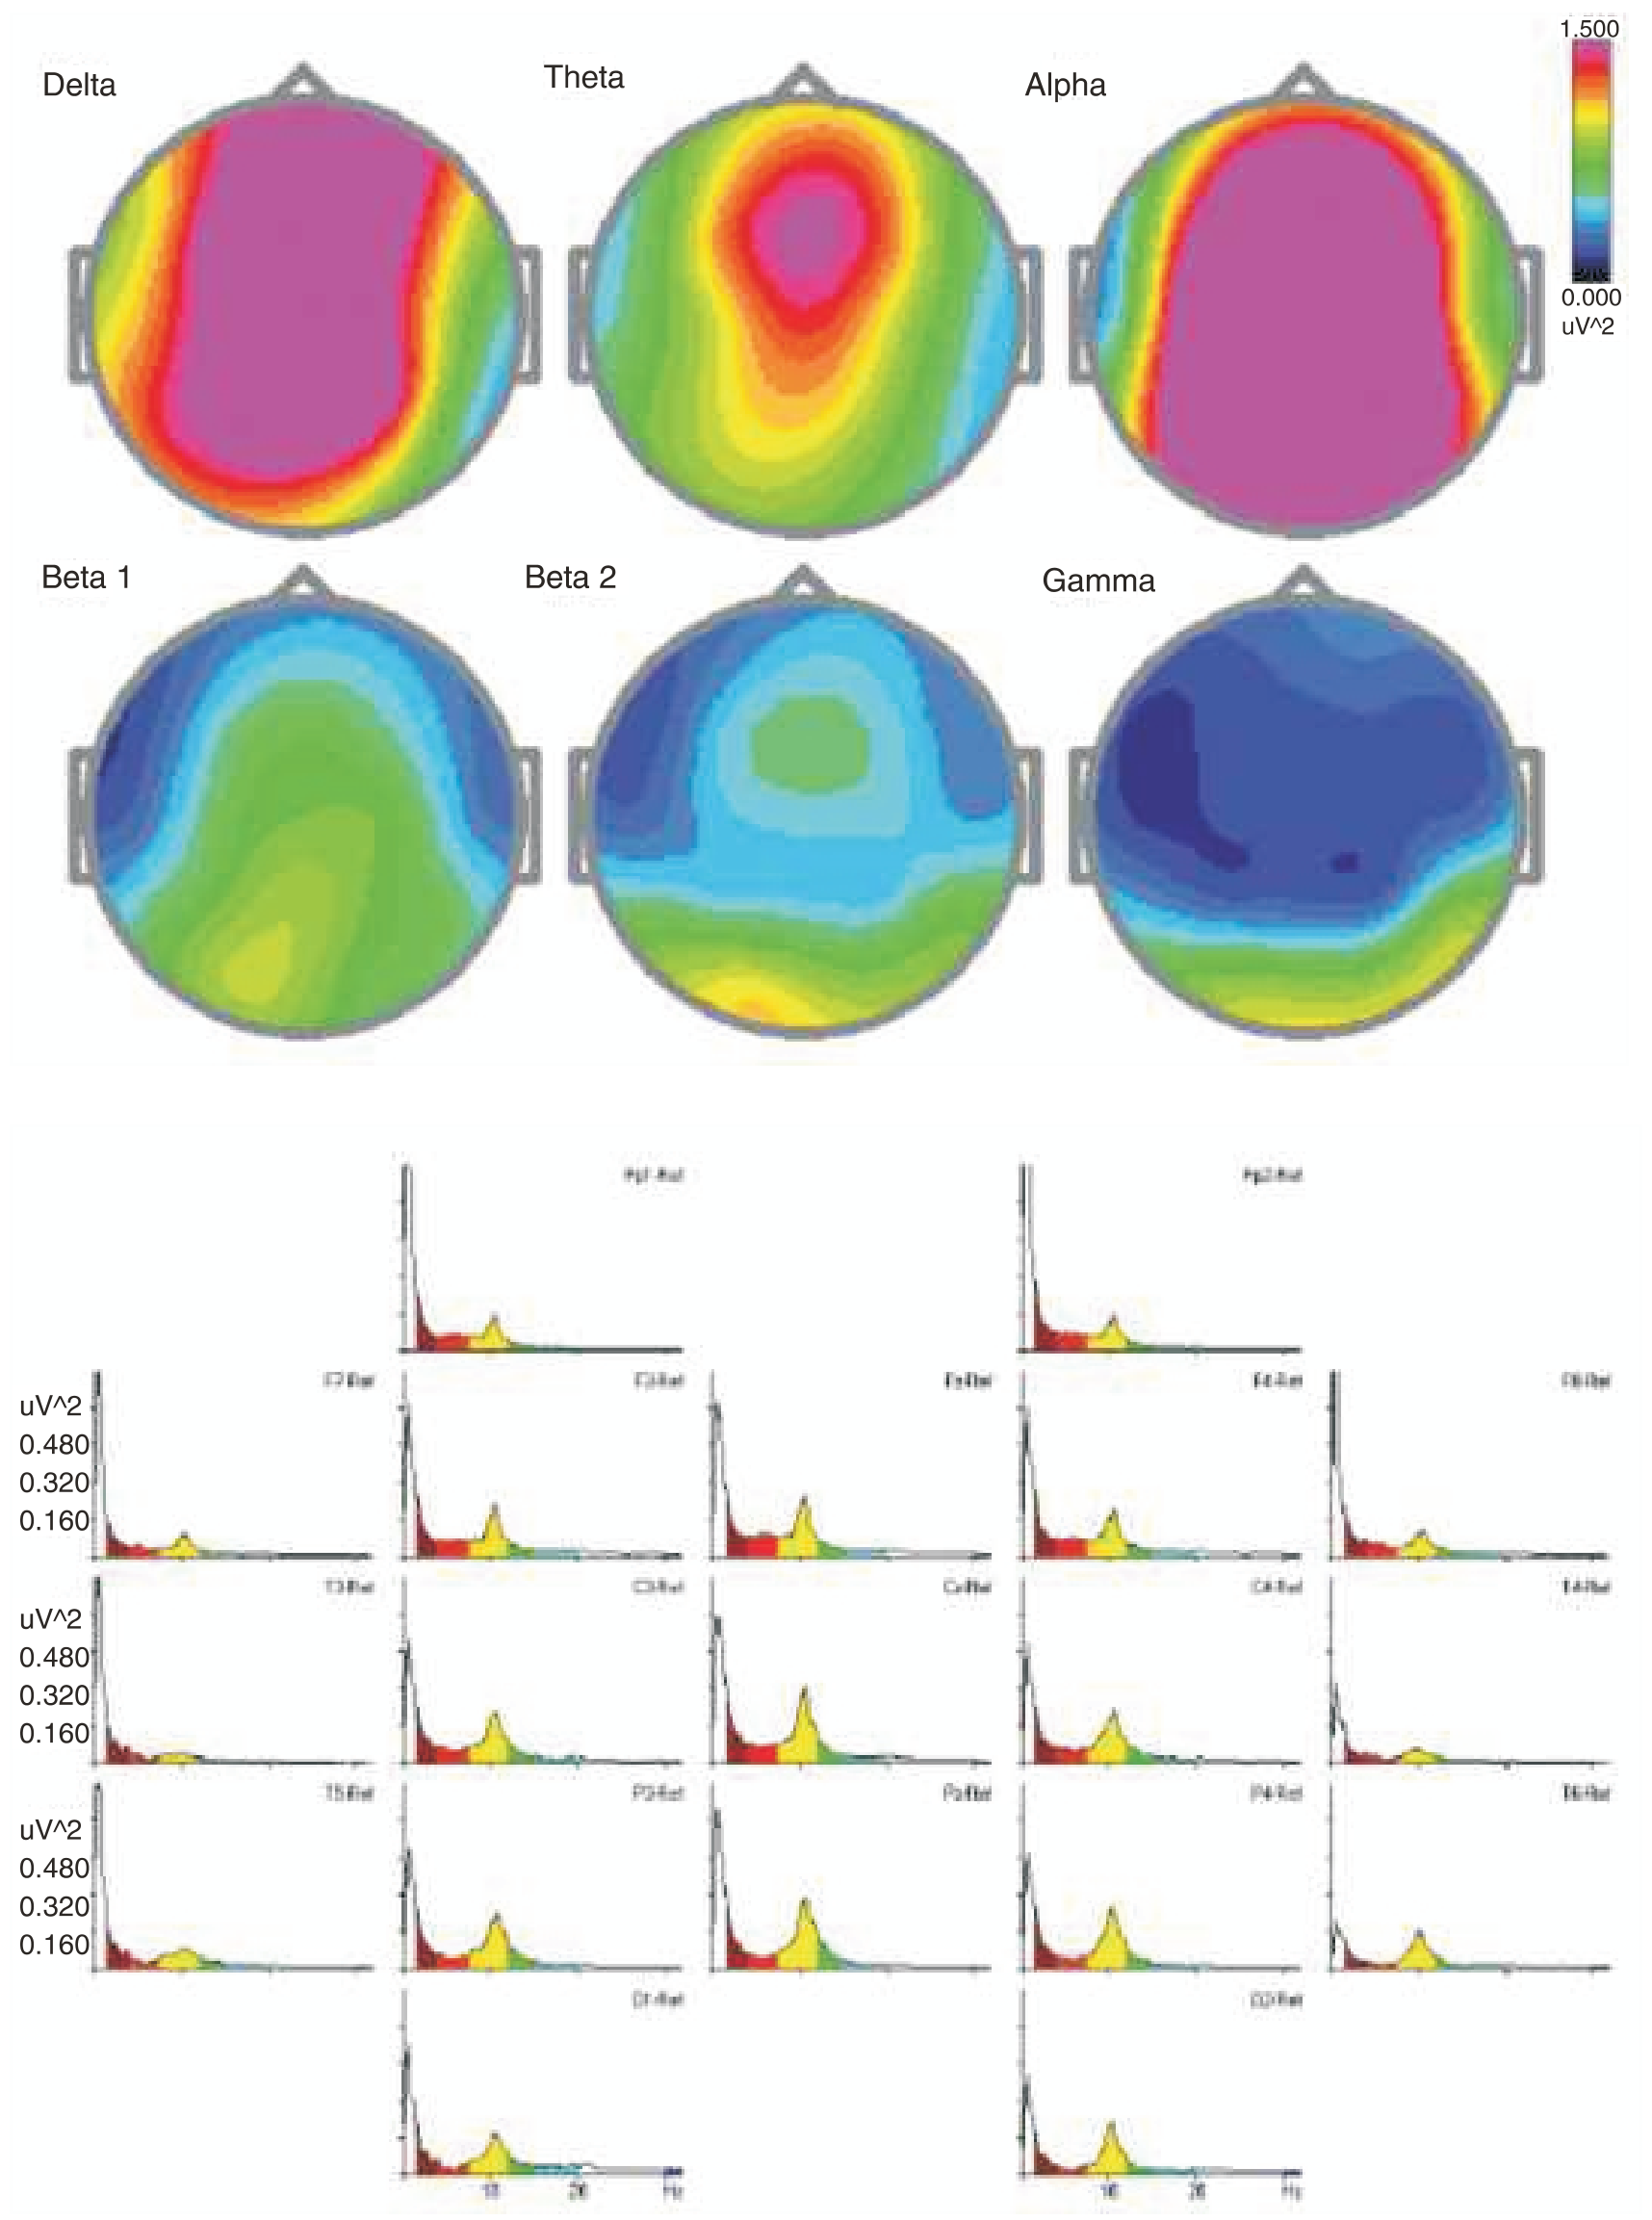
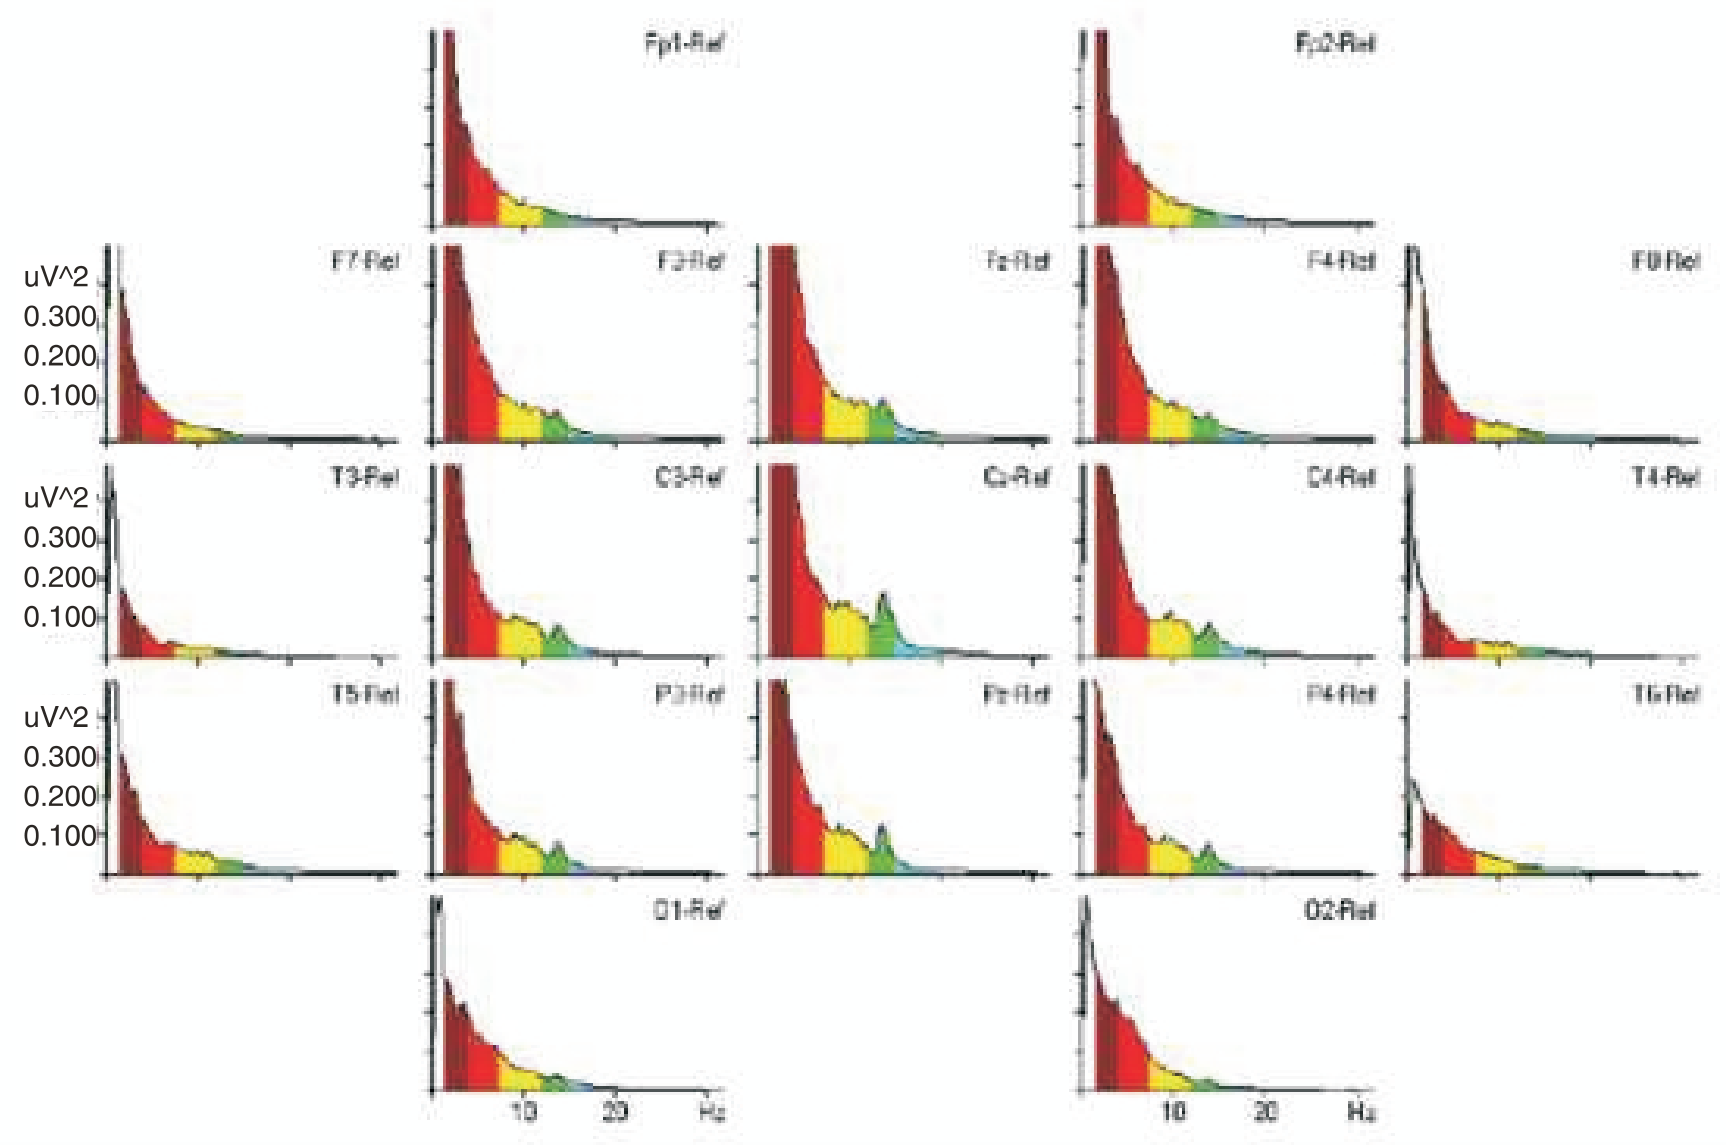
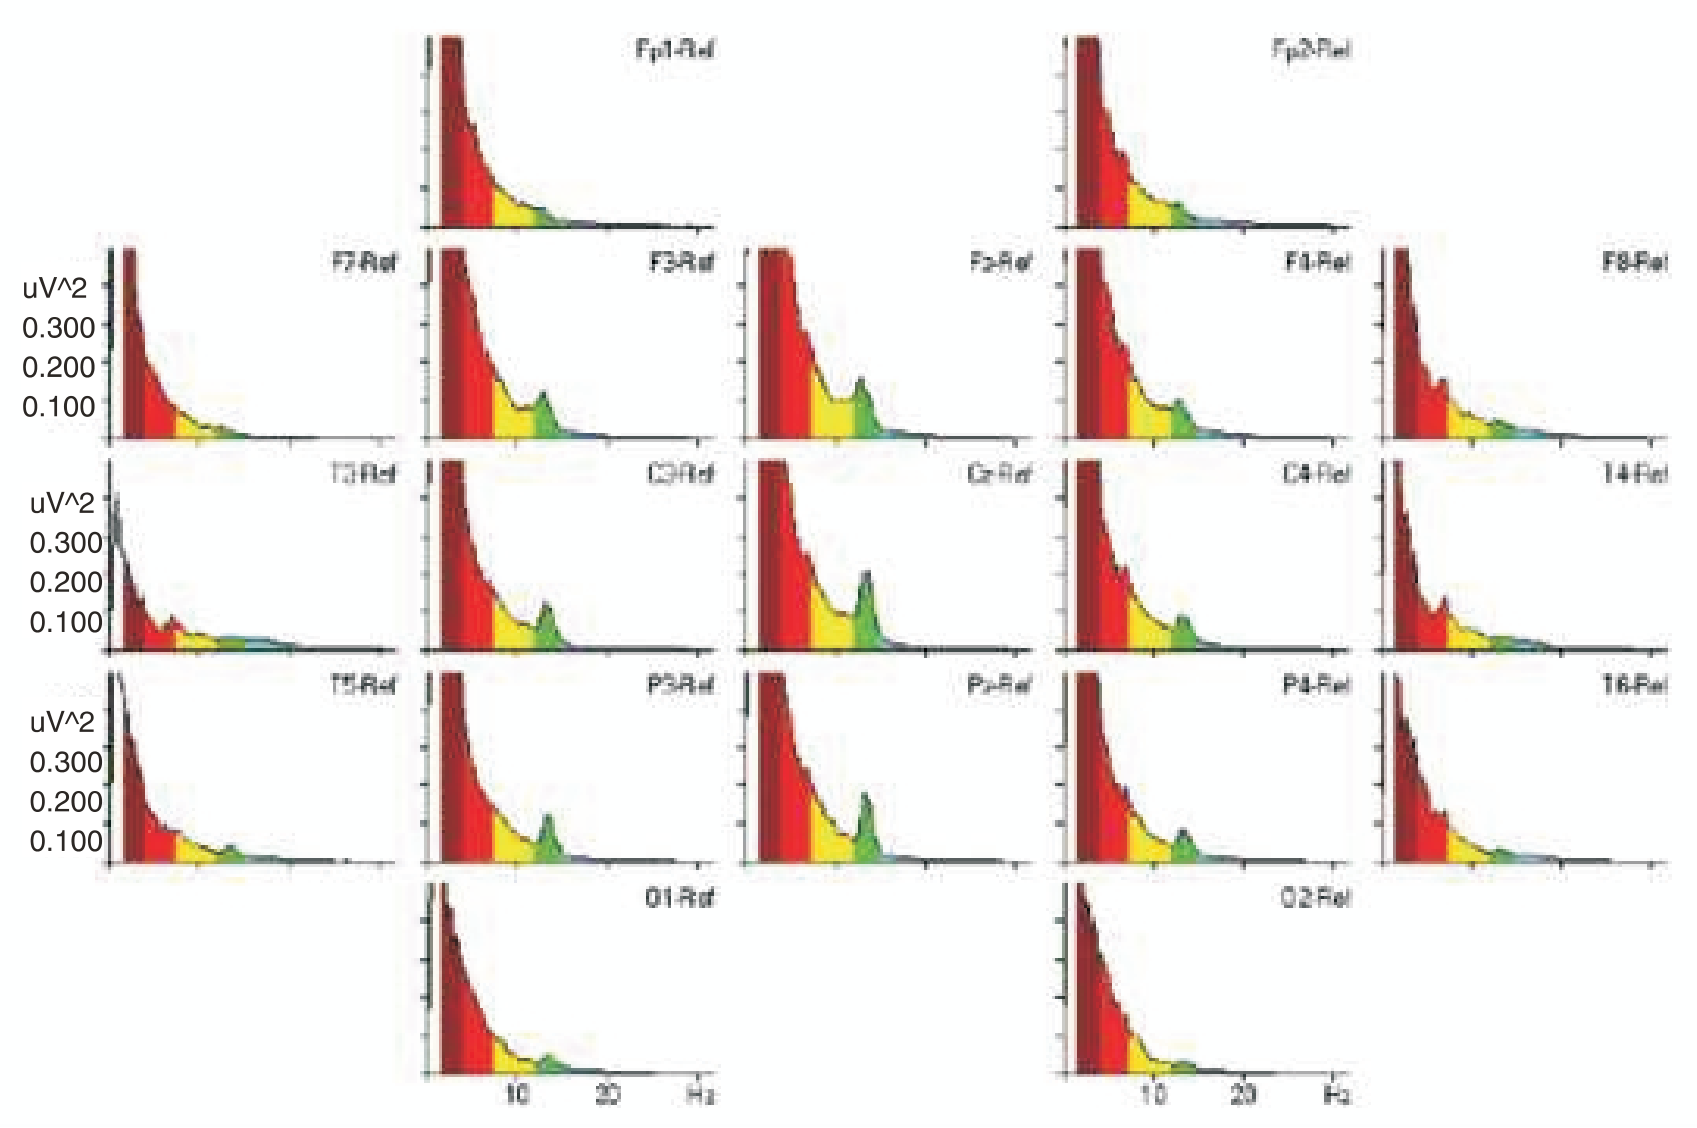
Power-frequency spectra reveals delta (1-4 Hz, burgundy) is the dominant rhythm, followed by theta (4-7.5 Hz, red) and some alpha (8-12 Hz, yellow).
19 channel International 10-20 electrocap hookup, linked ears referential using Mitsar equipment (St. Petersburg, Russia).
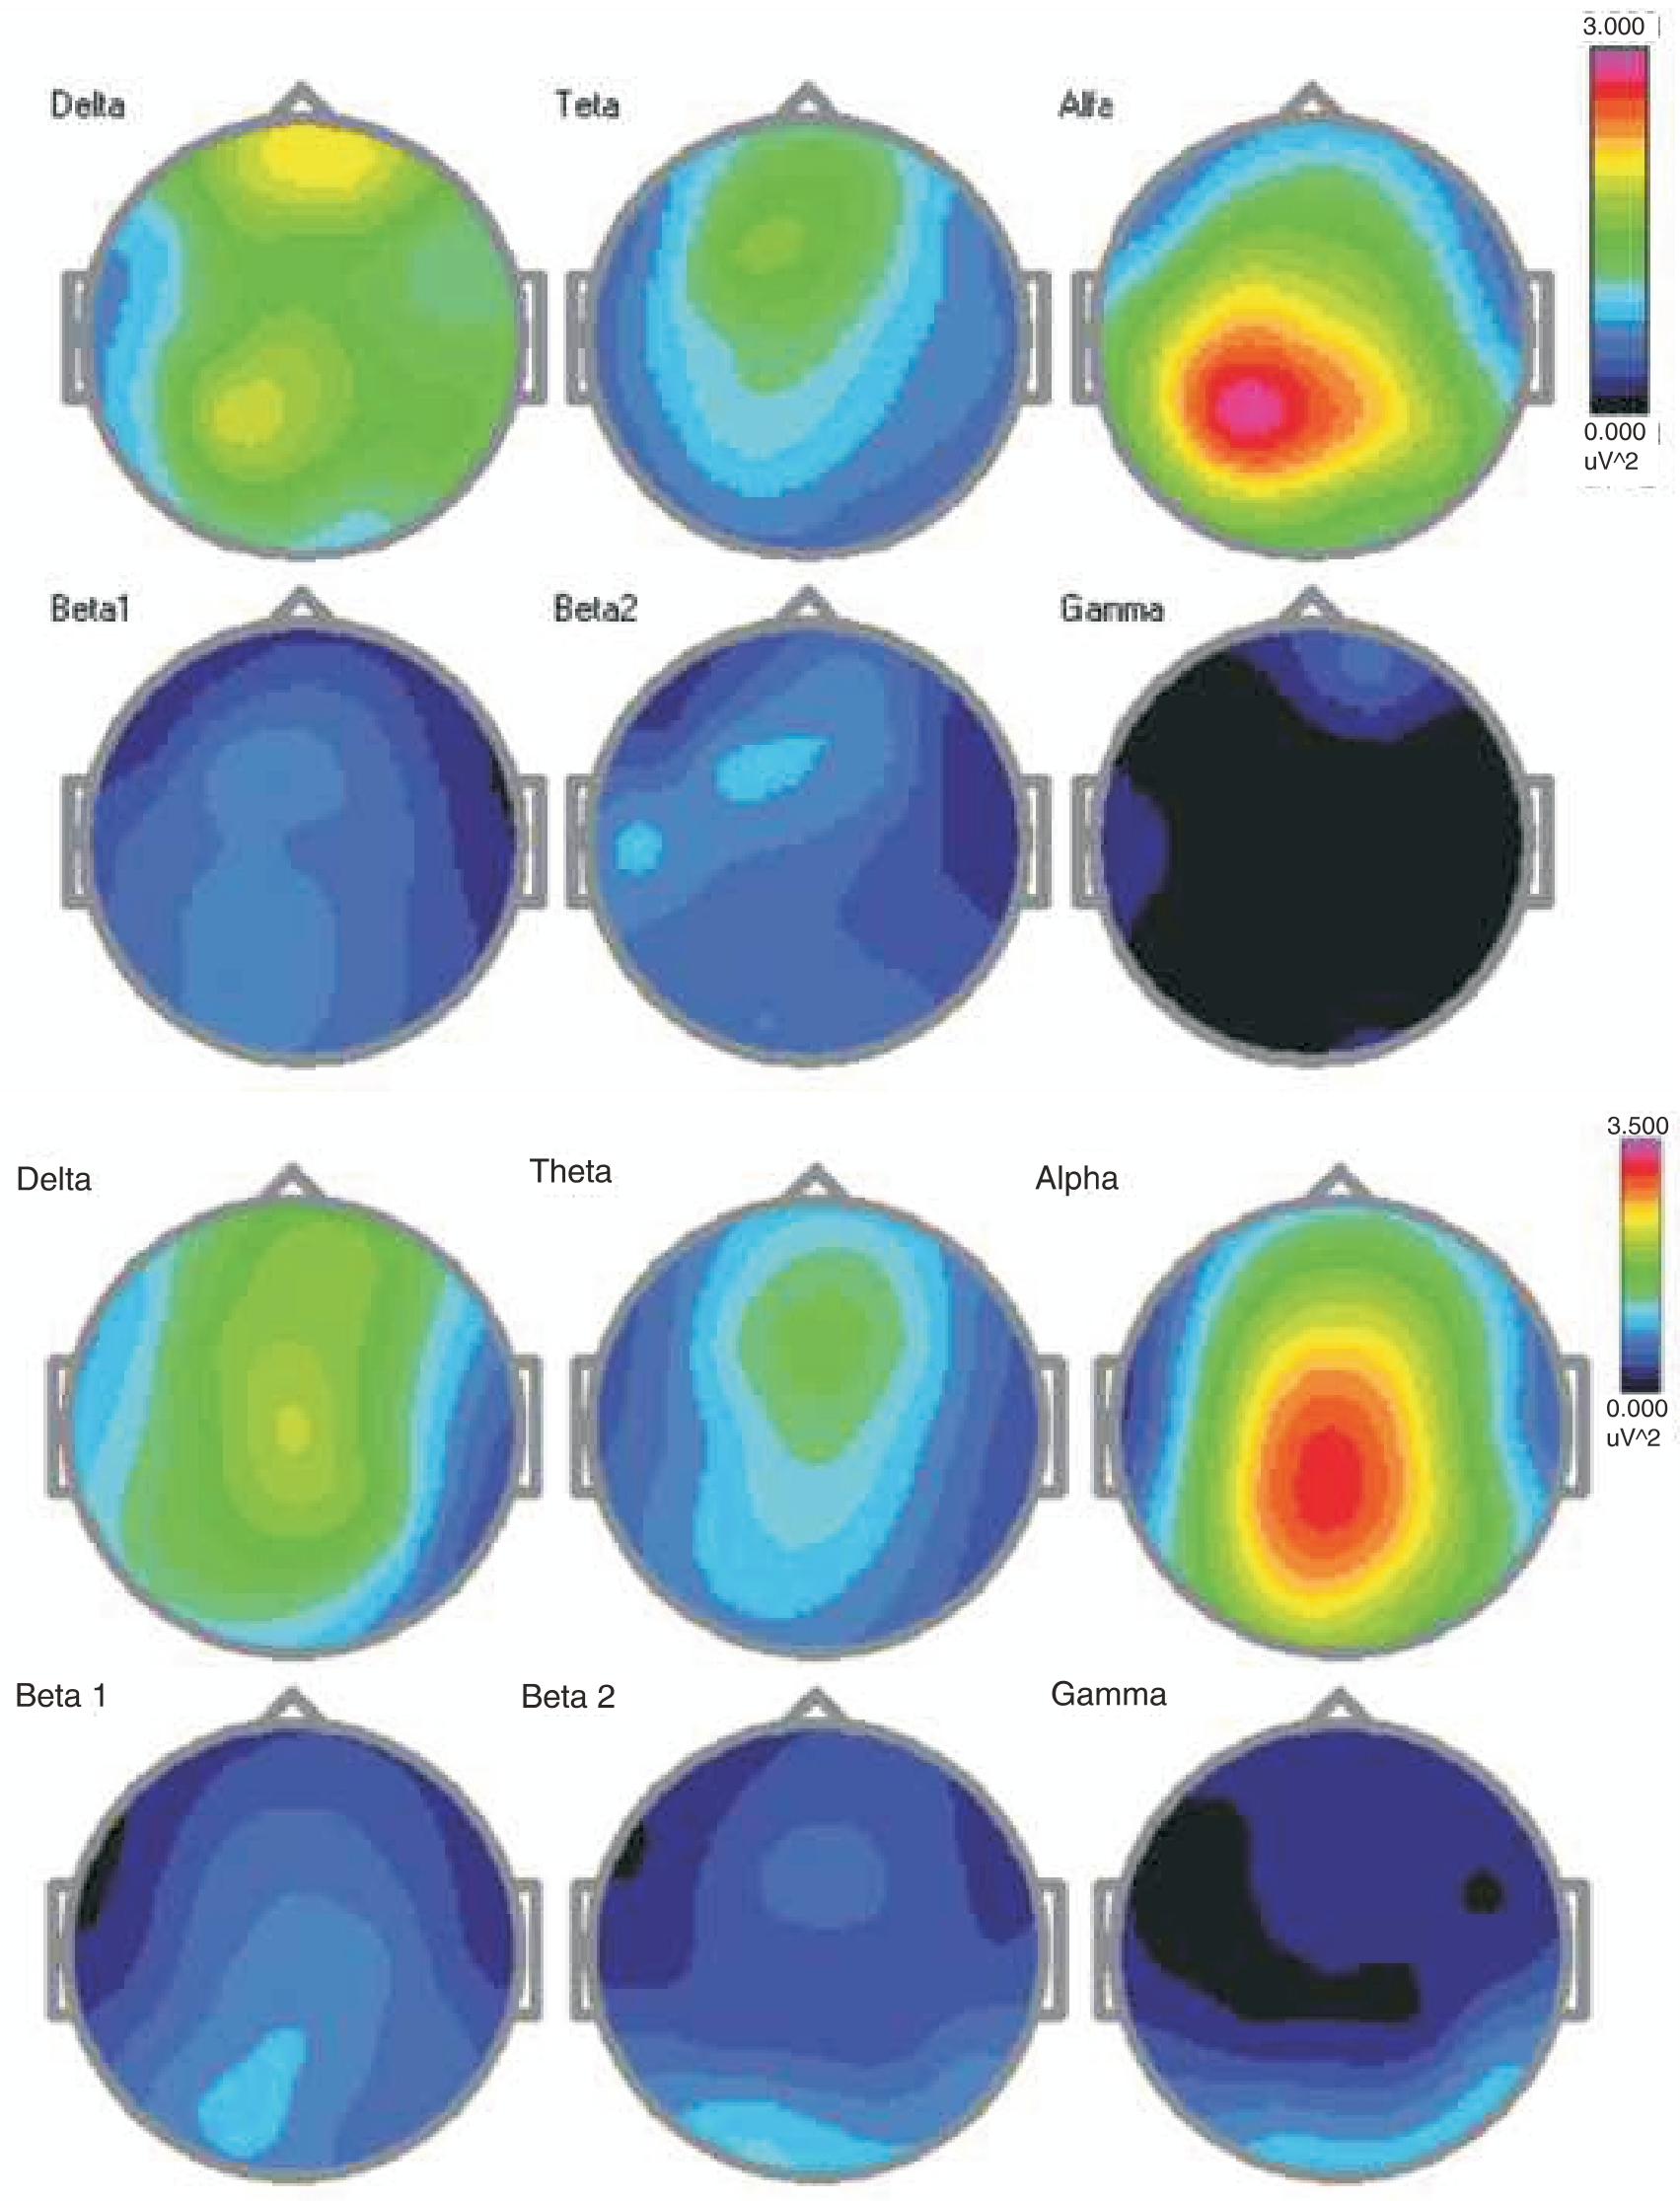
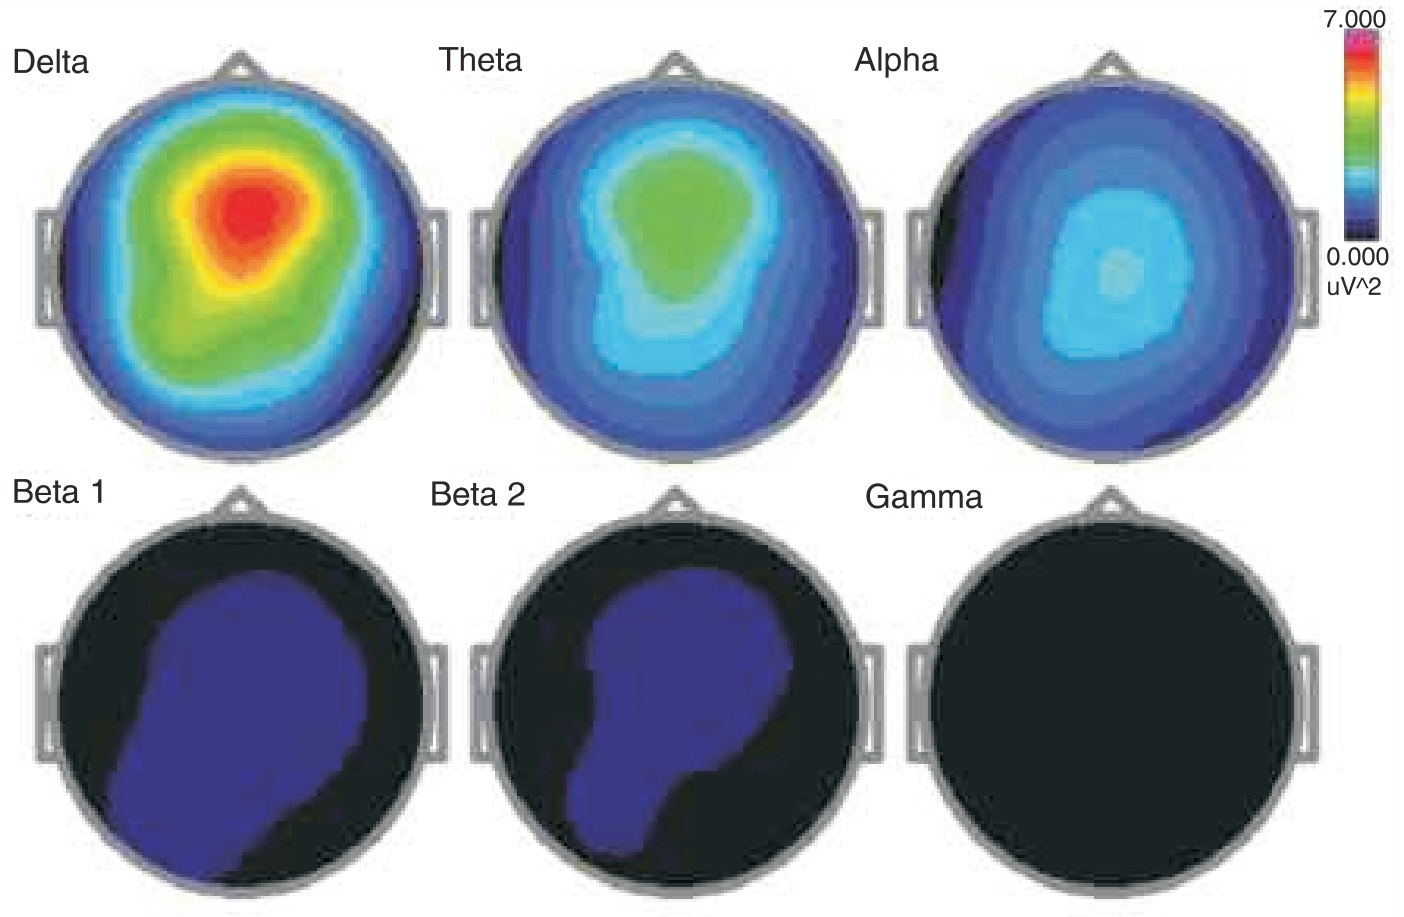
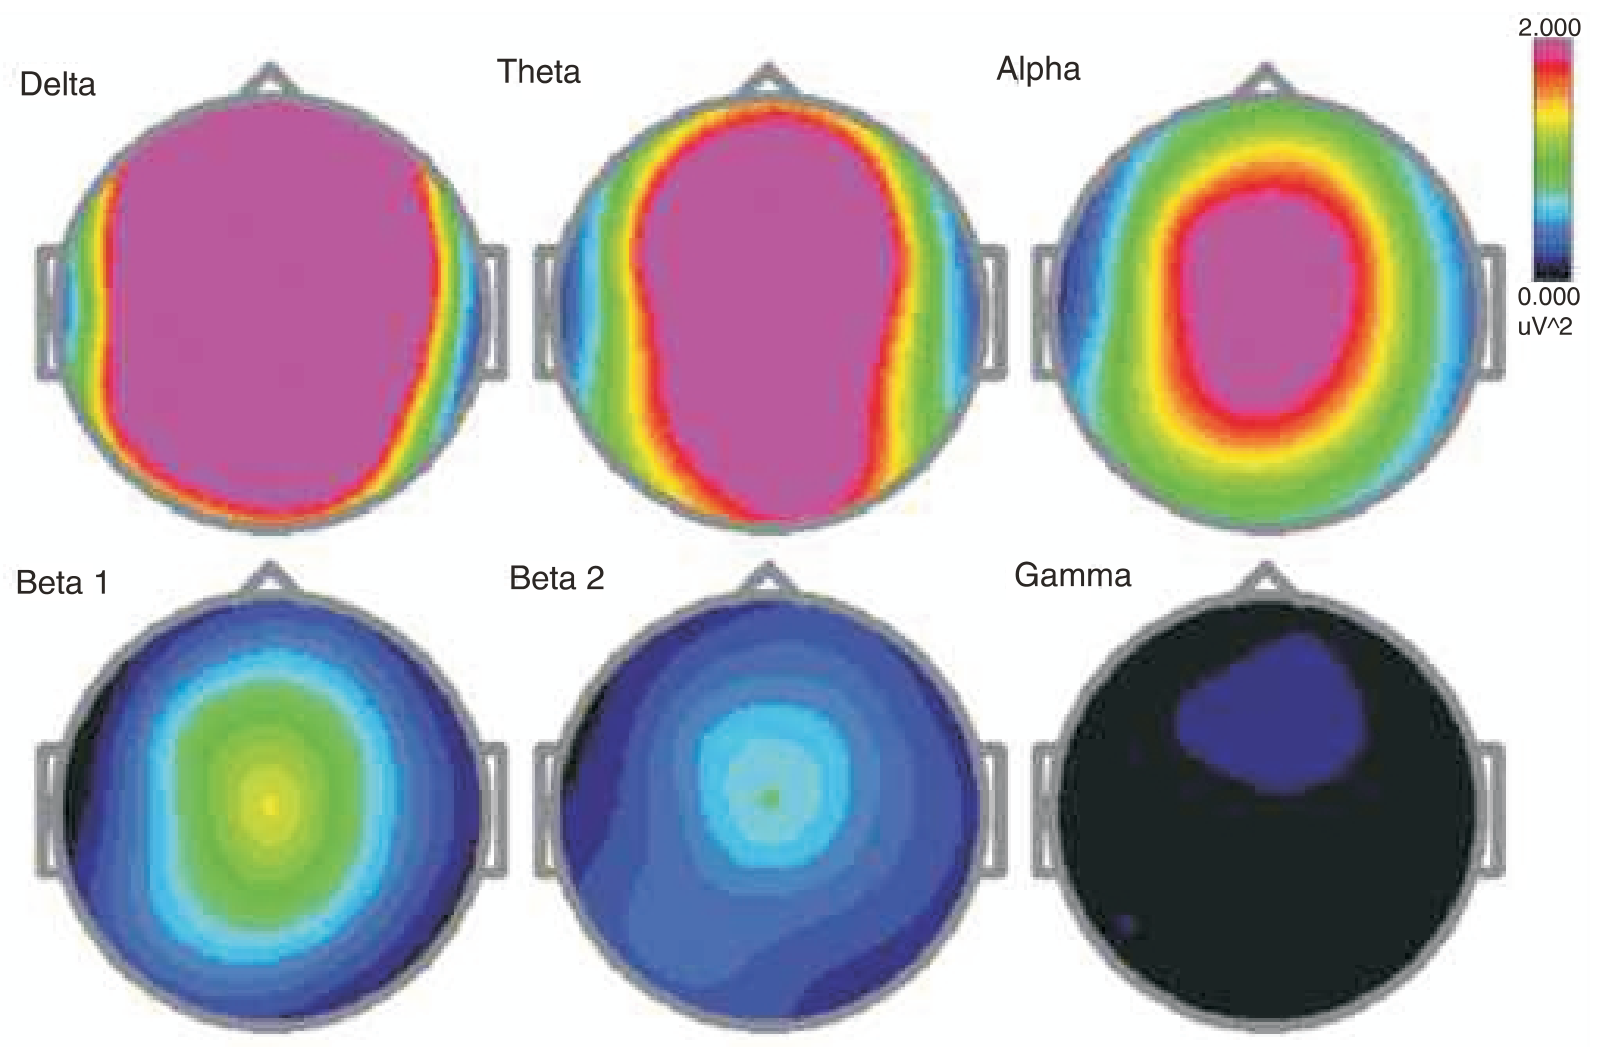
Baseline eyes closed. Topographic brainmap shows highest delta power localized at frontal-central sites.
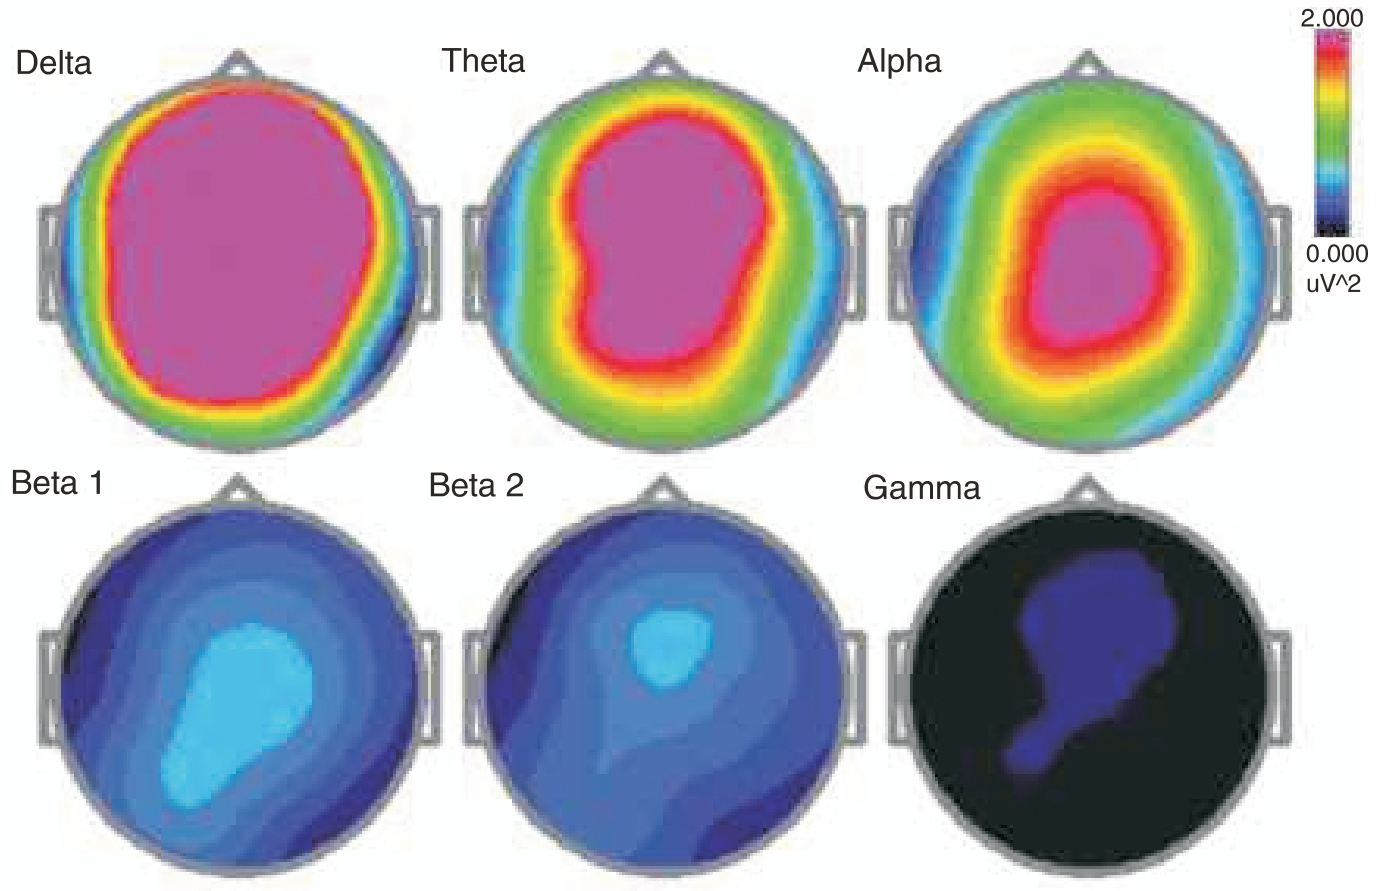
At higher gain setting topo maps reveal roughly symmetrical distribution of delta, theta and alpha around Fz and Cz (frontal and central vertex sites).
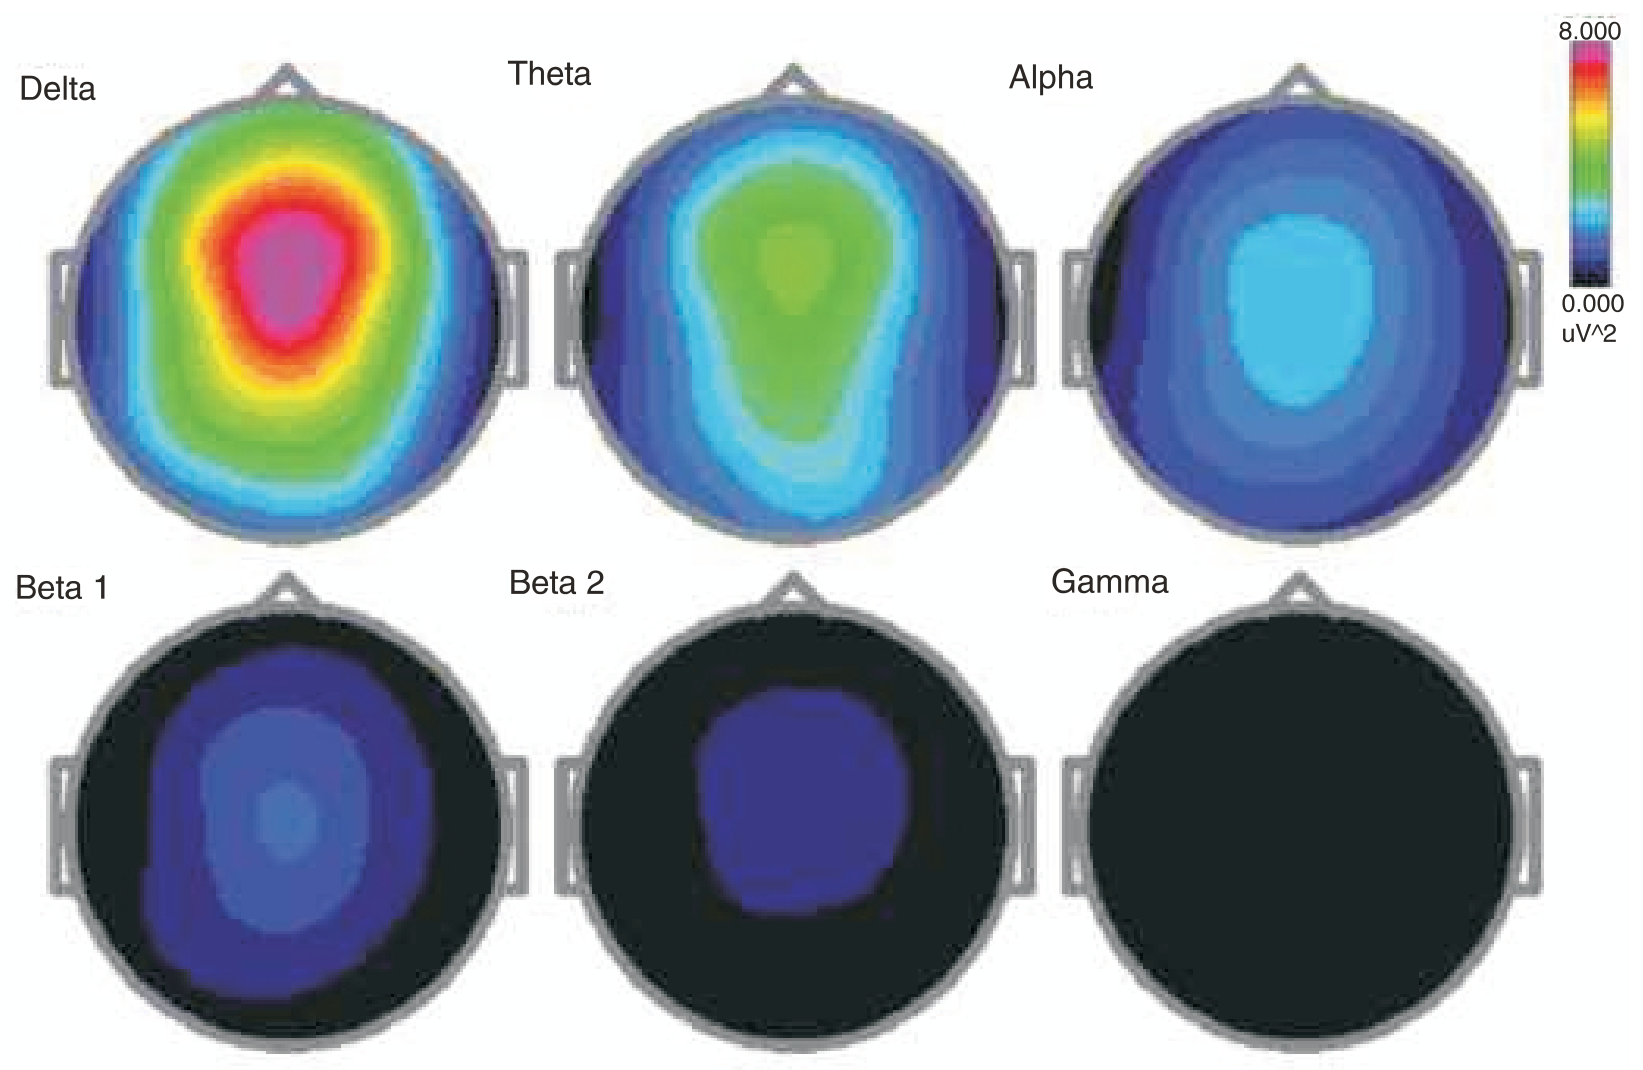
During meditation: Note the only difference compared with Baseline pattern is the slight increase in theta and alpha power, and also the appearance of small beta1 peak (12-15 Hz, SMR rhythm, green indicating increased focus during meditation).
Topo maps during meditation: Note increased beta rhythm: beta1 band reveals more green color (indicating increased power), and beta2 (15-20 Hz) now appears in light blue at same central site.
Deep Samadhi state: Shows a marked increase in beta1 power (SMR, green). This remarkable pattern of brainwaves during samadhi state demonstrates Swamiji is engaged in active focused state while still sustaining a high delta background state.
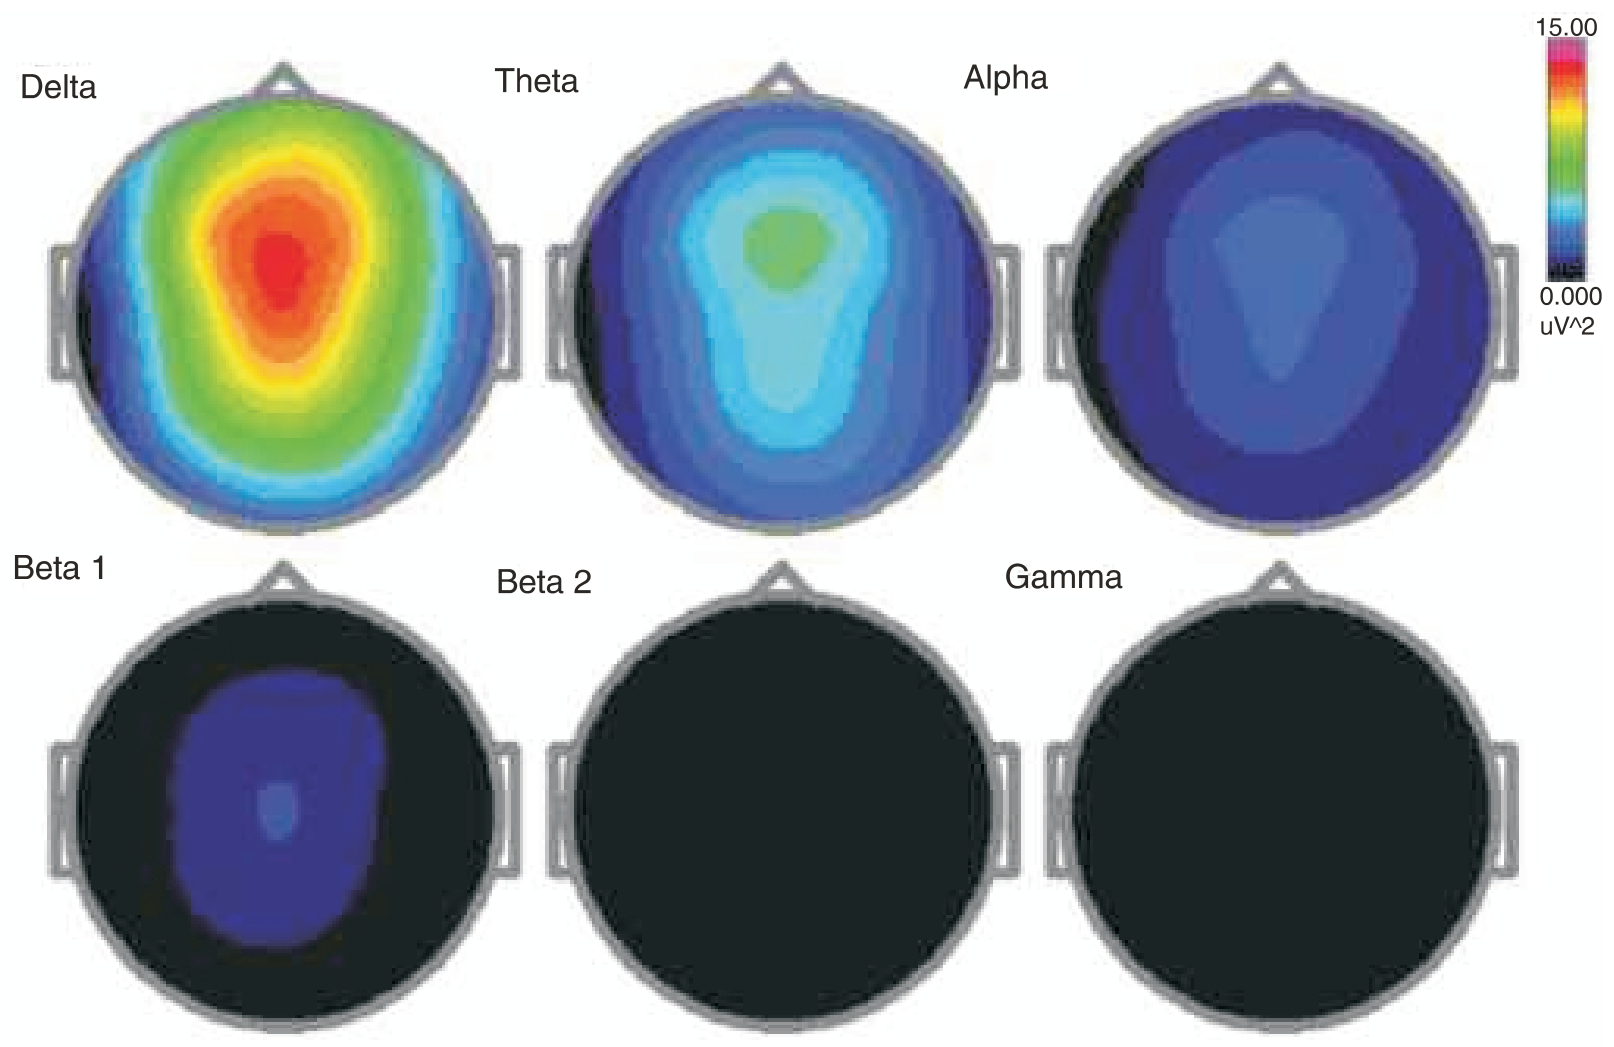
Samadhi state topo maps reveal marked increase in the background delta rhythm (note power scale is 15.0 at maximum, pink color).
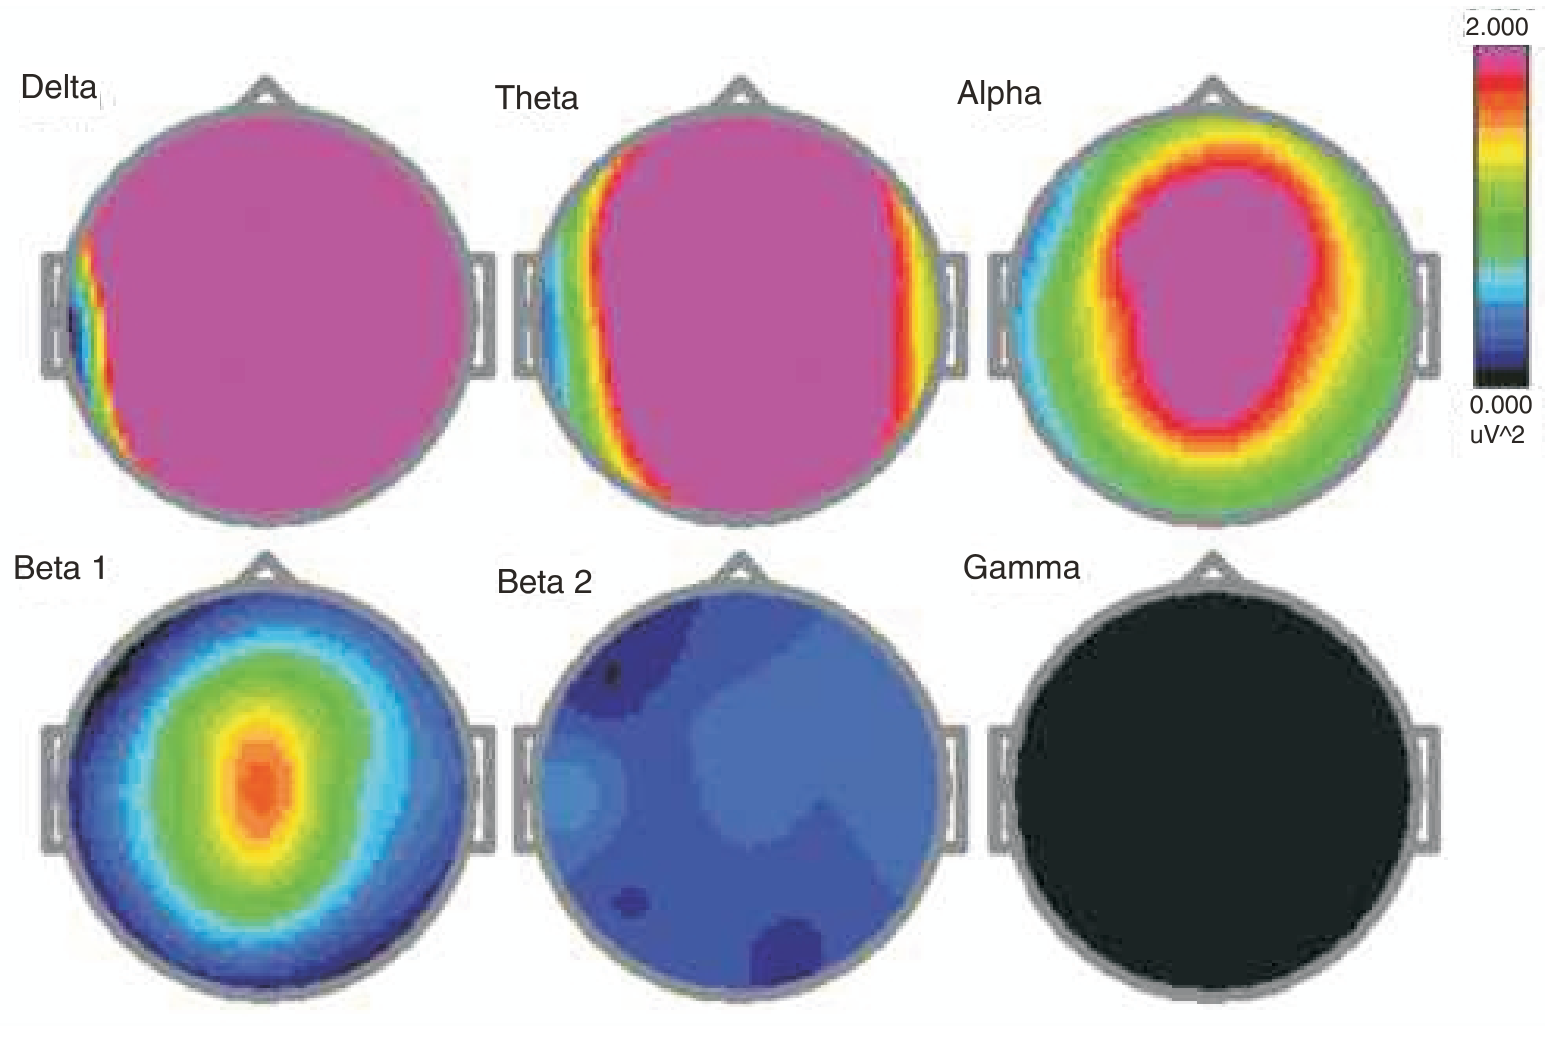
At higher gain, topo maps show some increased theta power and Beta1 (12-15 Hz, SMR), which is visible as orange color localized to central site (Cz, vertex).
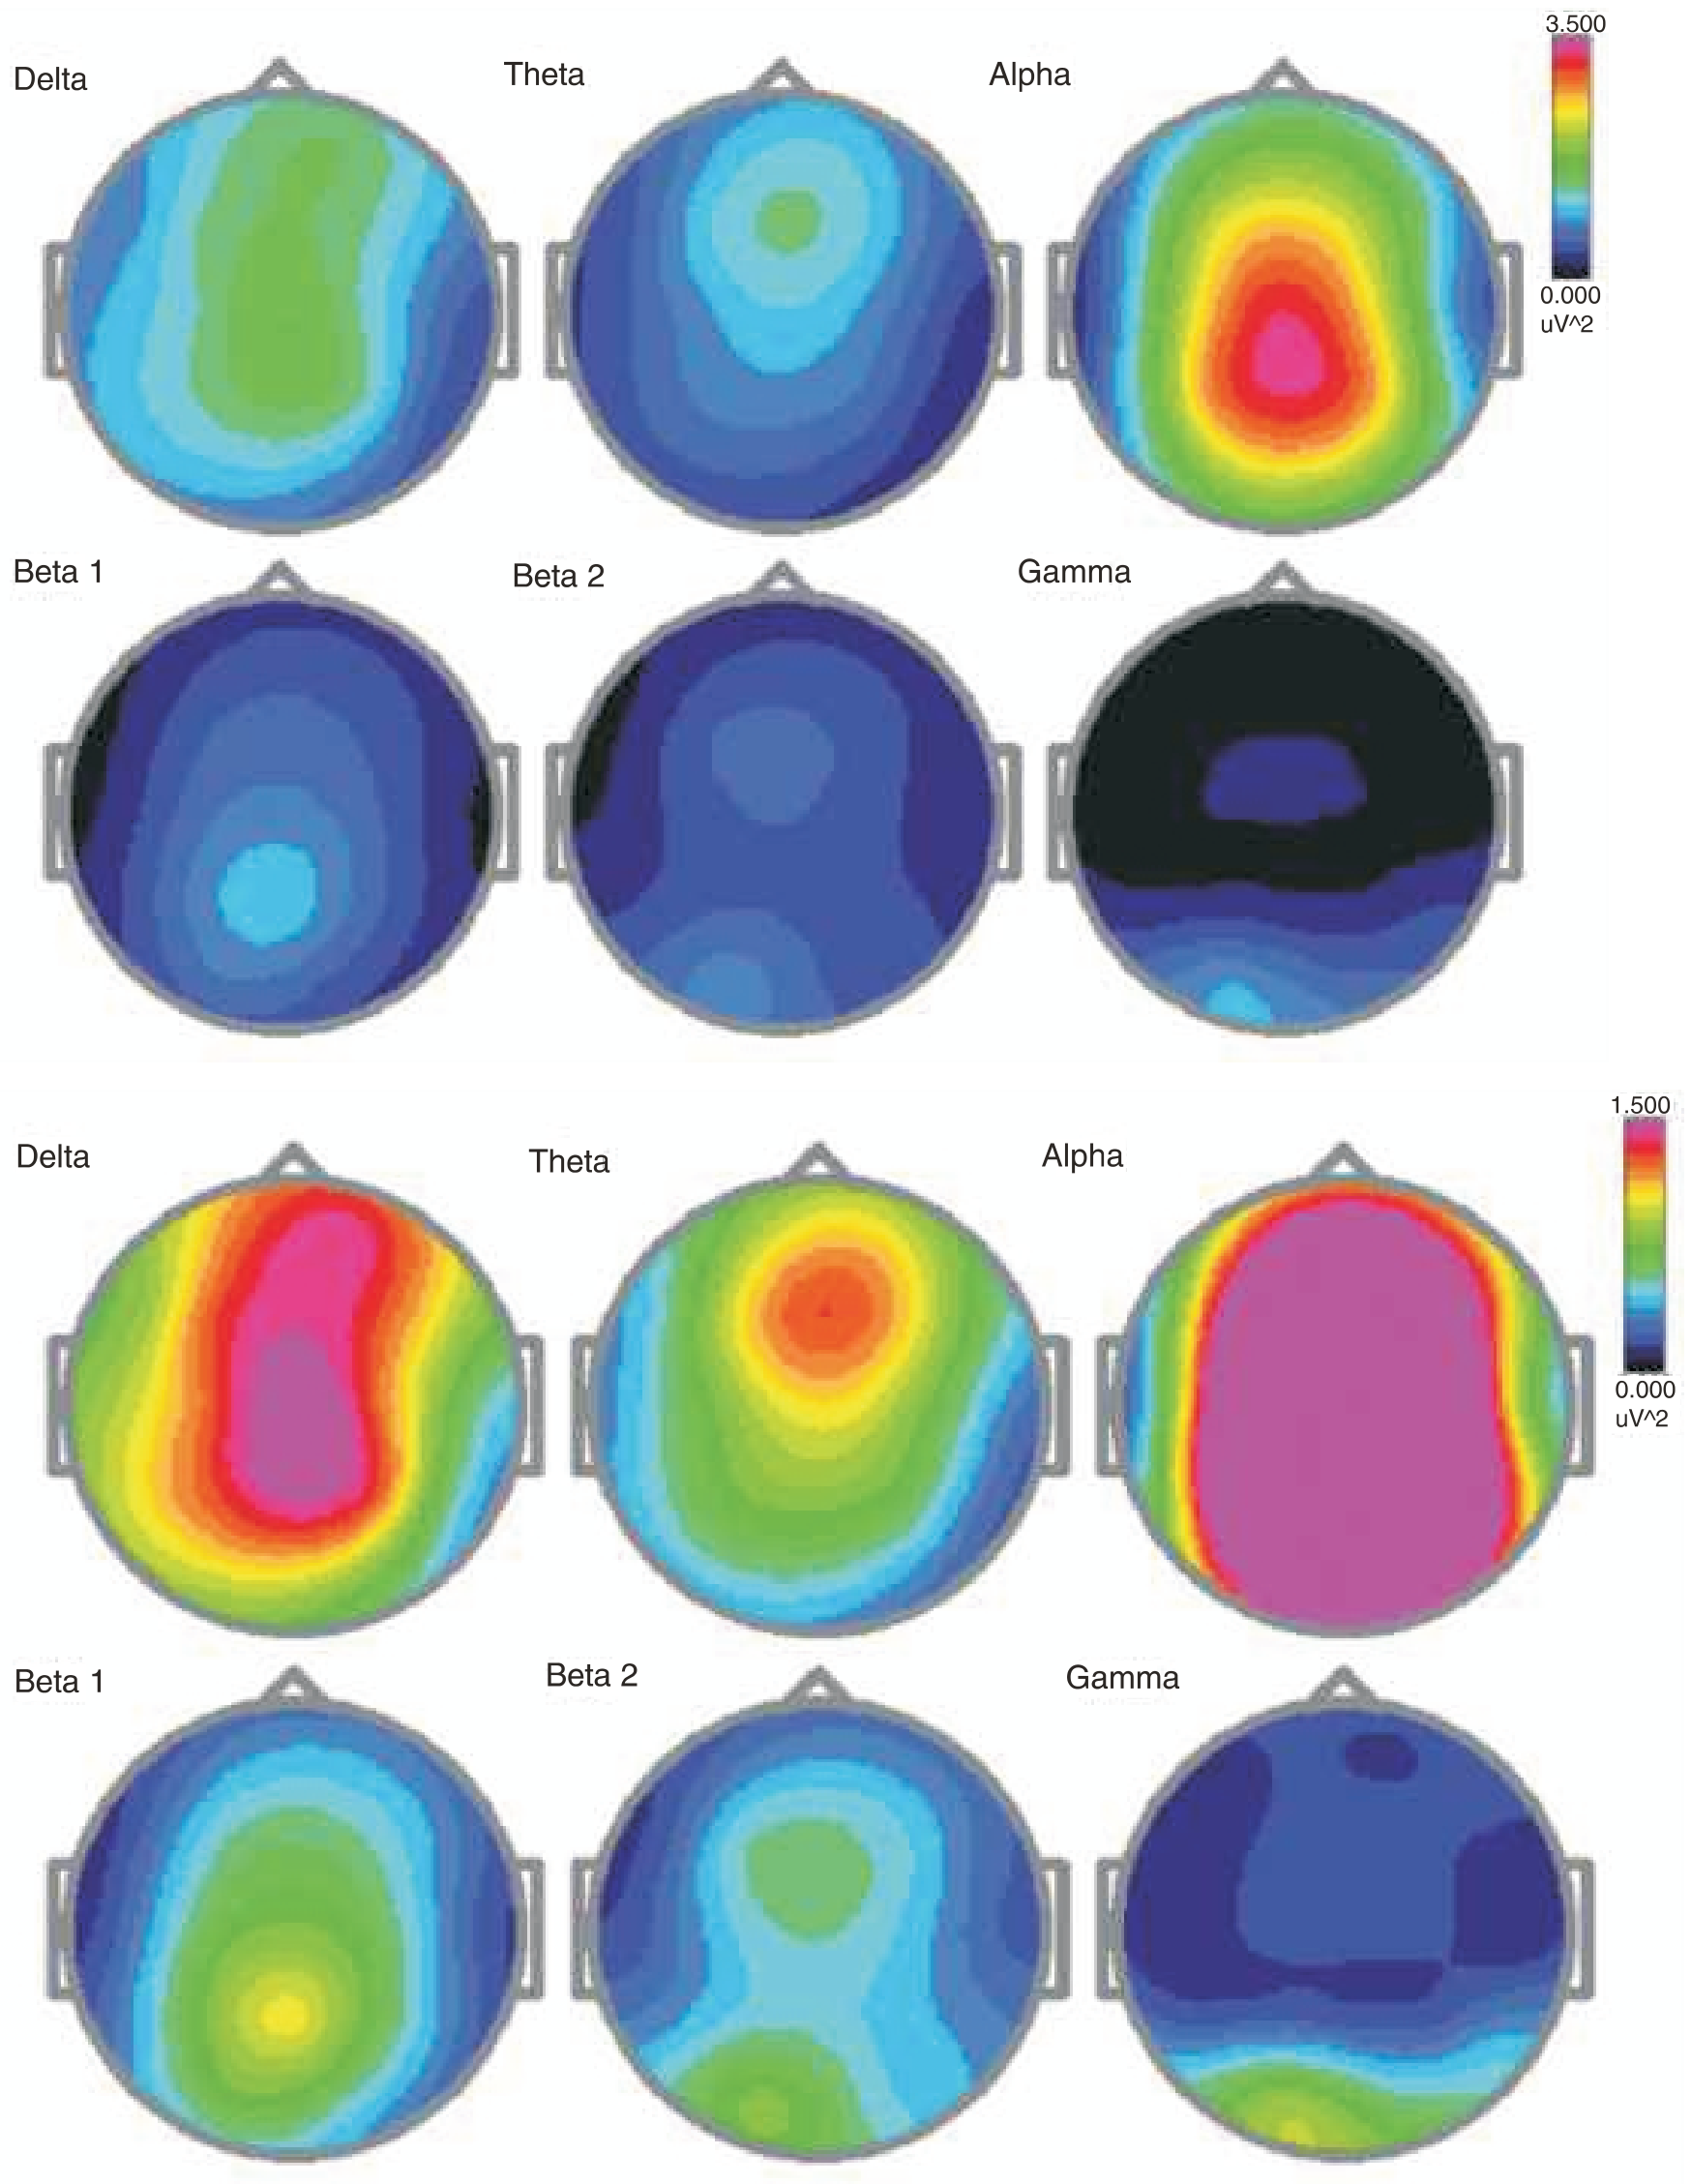
Healing State: This analysis revealed a striking shift of brainstate during healing; alpha rhythm (8-12 Hz, yellow) now shows marked increase and slow rhythms (mostly delta) are markedly suppressed. This finding is consistent with my previous studies with many energy healers, (Acosta-Urquidi, J., 2004, JACM, vol. 10, no. 4, p.725.)
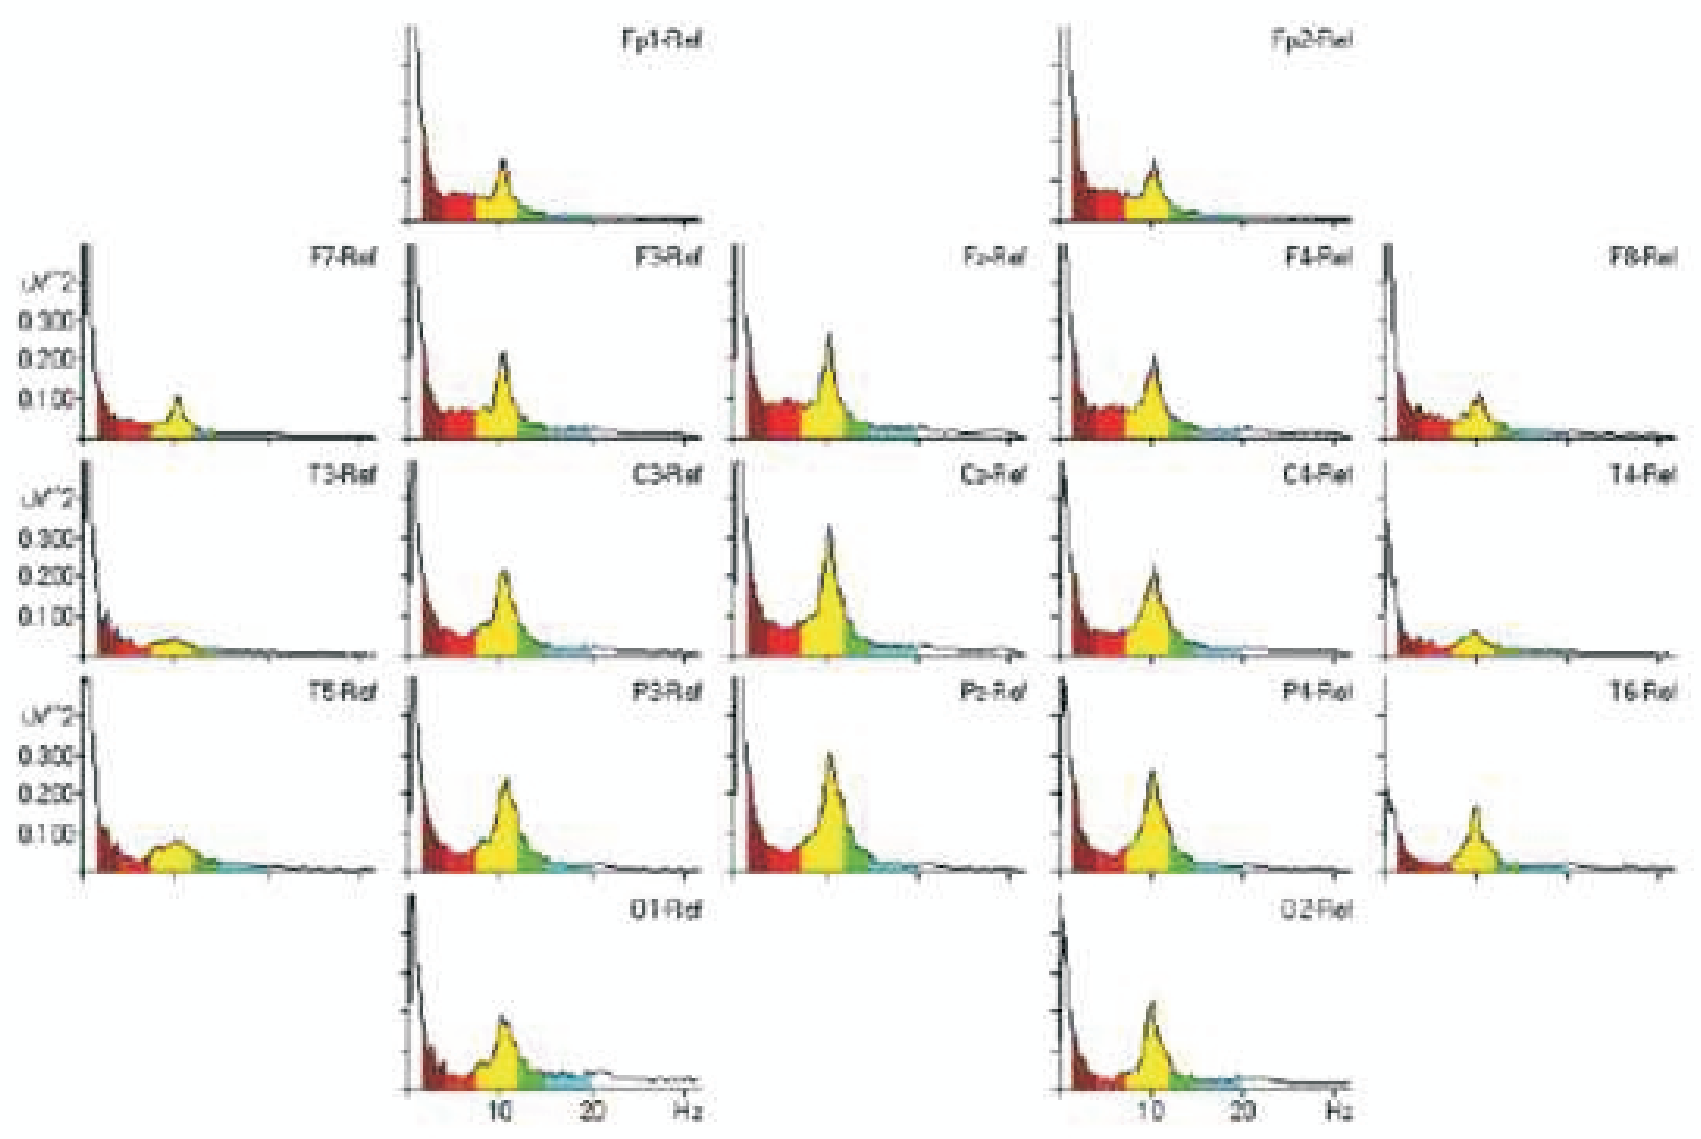
Conclusion: Swamiji demonstrated a remarkable ability to shift into different brainstates during meditation, samadhi and healing conditions. The change between his baseline pattern and meditation is small, indicating that he is always in a permanent state of meditation when he sits still with eyes closed.
Baseline eyes open condition: Power-frequency spectra data from an earlier recording session on 6/ 05, shows alpha band is dominant, with some small amount of theta during eyes open condition. FP2 high frequency (20-30 Hz) is due to EMG contamination (muscle signals).
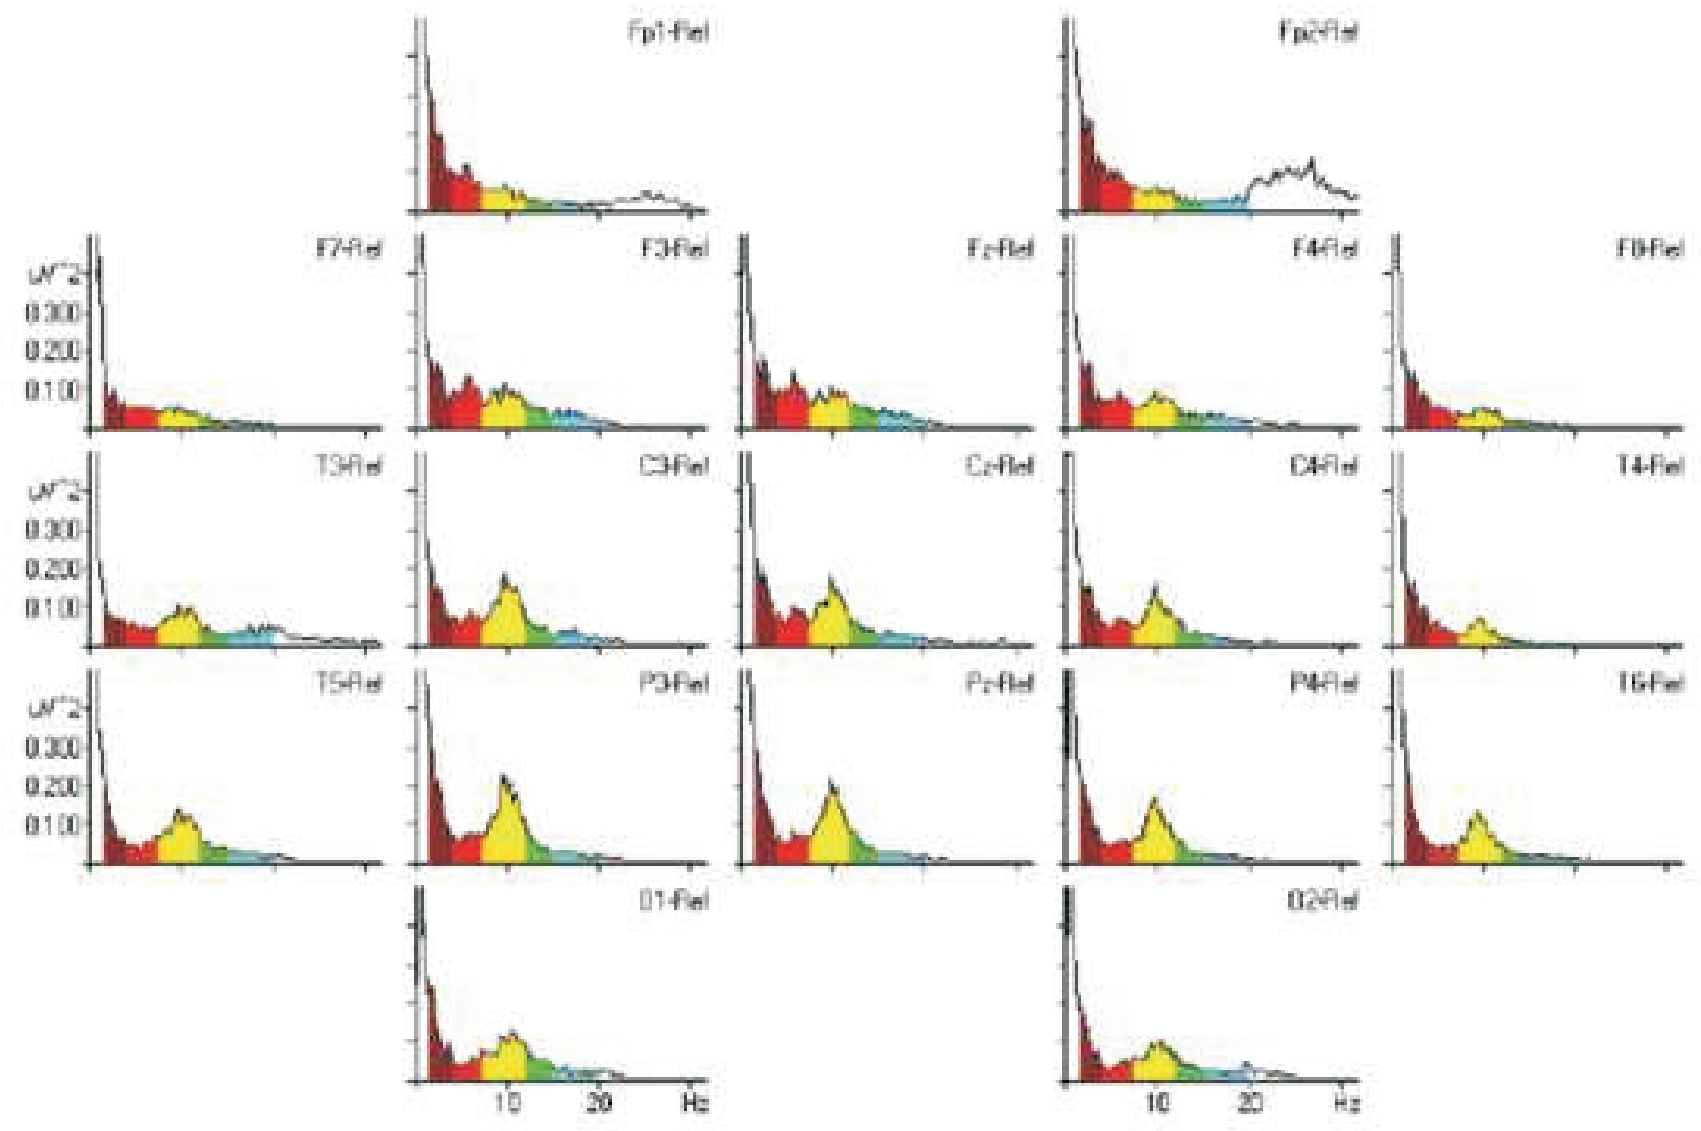
Topo maps showing the dominant alpha state during eyes open condition.